Category Archives: News

Irvine Housing Numbers by Neighborhood: October 2013

For a snapshot of the Irvine housing numbers by neighborhood in 2012, see my previous post. And for a look at what is happening this year, see the following:

Area

List Price/# Homes Listed

Sold Price/# Homes Sold

List Per SF

Sold Per SF

% Chg Y-O-Y Sold Price/SF

Airport/IBC

13-Oct

13-Jul

$598K/68

$699K/71

$480K/25

$428K/24

$433

$439

$398

$428

17.4%

32.90%

13-Apr

$713K/37

$460K/31

$410

$376

24.50%

13-Jan

$694K/40

$440K/13

$398

$333

8.10%

Columbus Grove

n/a

El Camino Real

13-Oct

13-Jul

$680K/19

$704K/20

$602K/14

$555K/11

$408

$399

$383

$349

22%

-2.80%

13-Apr

$607K/10

$490K/11

$369

$393

36.50%

13-Jan

$535K/17

$555K/12

$366

$380

42.30%

Northpark

13-Oct

13-Jul

$638K/55

$649K/35

$682K/30

$592K/32

$379

$391

$375

$392

15.7%

35.60%

13-Apr

$625K/25

$625K/31

$359

$341

20.50%

13-Jan

$722K/24

$466K/22

$351

$321

15.90%

Northwood

13-Oct

13-Jul

$707K/92

$674K/72

$746K/44

$826K/46

$401

$411

$387

$388

15.9%

14.50%

13-Apr

$798K/33

$738K/34

$377

$362

16.80%

13-Jan

$750K/23

$750K/25

$373

$305

4.50%

Oak Creek

13-Oct

13-Jul

$377K/22

$612K/24

$458K/9

$430K/20

$409

$408

$409

$395

31.1%

36.20%

13-Apr

$330K/13

$435K/25

$361

$359

14%

13-Jan

$362K/14

$362K/14

$362

$338

29.50%

Orange Tree

13-Oct

13-Jul

$324K/12

$340K/7

$262K/3

$369K/9

$399

$396

$378

$389

28.8%

34.10%

13-Apr

$300K/9

$274K/8

$380

$326

60.60%

13-Jan

$278K/8

$328K/4

$345

$332

33.30%

Portola Springs

13-Oct

13-Jul

$772K/28

$700K/19

$775K/7

$640K/7

$381

$400

$387

$389

28.1%

22.70%

13-Apr

$608K/4

$667K/11

$347

$385

28.80%

13-Jan

$1,024K/8

$614K/8

$375

$329

12.30%

Quail Hill

13-Oct

13-Jul

$639K/20

$599K/21

$649K/10

$829K/13

$406

$439

$419

$414

7.4%

6.40%

13-Apr

$754K/14

$860K/14

$413

$431

15.20%

13-Jan

$790K/10

$600K/7

$414

$341

4.60%

Rancho San Joaquin

13-Oct

13-Jul

$600K/6

$679K/6

$640K/3

$648K/1

$397

$383

$329

$319

6.8%

18.60%

13-Apr

na/0

$486K/4

n/a

$367

n/a

13-Jan

$564K/2

na/0

$333

n/a

n/a

Shady Canyon

13-Oct

13-Jul

$6,499K/29

$5,988K/26

$3,800K/1

$4,300K/3

$762

$786

$655

$717

2.7%

22.40%

13-Apr

$5,995K/23

$4,538K/2

$776

$777

51.80%

13-Jan

$5,700K/15

$6,675K/1

$736

$668

25.10%

Turtle Ridge

13-Oct

13-Jul

$1,647K/38

$1,800K/27

$1,795K/6

$1,699K/12

$624

$625

$582

$628

41.3%

23.10%

13-Apr

$1,414K/22

$940K/13

$594

$531

26.10%

13-Jan

$2,302K/10

$1,295K/6

$605

$532

49.90%

Turtle Rock

13-Oct

13-Jul

$1,249K/32

$1,245K/33

$1,290K/11

$1,150K/13

$501

$519

$525

$514

24.4%

13%

13-Apr

$1,025K/21

$895K/12

$545

$462

0.20%

13-Jan

$949K/13

$946K/8

$434

$466

58%

University Park

13-Oct

13-Jul

$739K/13

$749K/14

$691K/6

$720K/15

$408

$403

$400

$420

10.2%

0.70%

13-Apr

$625K/9

$661K/11

$406

$327

20.20%

13-Jan

$625K/7

$570K/10

$330

$351

26.70%

University Town Center

13-Oct

13-Jul

$636K/1

$505K/9

$504K/4

$716K/2

$397

$422

$380

$361

5.8%

14.20%

13-Apr

$589K/2

$477K/2

$365

$393

19.50%

13-Jan

$551K/1

$575K/1

$407

$377

19.70%

Walnut

13-Oct

13-Jul

$759K/7

$740K/15

$726K/6

$666K/9

$377

$390

$341

$386

6.9%

20.20%

13-Apr

$620K/6

$580K/11

$398

$395

29.10%

13-Jan

$430K/3

$657K/4

$350

$275

6.20%

West Irvine

n/a

Westpark

13-Oct

13-Jul

$800K/15

$650K/17

$650K/9

$615K/12

$424

$408

$382

$401

4.4%

37.80%

13-Apr

$824K/6

$700K/6

$411

$414

33.10%

13-Jan

$589K/4

$745K/6

$486

$340

-4.50%

Woodbridge

13-Oct

13-Jul

$662K/44

$539K/60

$578K/28

$512K/40

$393

$400

$397

$401

21.8%

23.40%

13-Apr

$585K/31

$659K/34

$409

$377

30.40%

13-Jan

$694K/22

$500K/22

$363

$357

30.80%

Woodbury

13-Oct

13-Jul

$790K/53

$697K/42

$665K/15

$711K/12

$427

$436

$398

$413

24%

43.90%

13-Apr

$699K/19

$647K/28

$424

$404

38.80%

13-Jan

$635K/11

$645K/17

$382

$331

13.40%

Source: Redfin (redfin.com)

A Look at Some Housing Stats for Irvine and Surrounding Cities: Nov 2013 Update

One of my posts from July of this year provided stats on the Irvine housing market and some surrounding cities. Today we will take an updated look at these numbers. These two sets of numbers can be used to do some then-and-now comparison. The following numbers are for the ninety days that precede November 3.

What is your conclusion? Has the local housing market gone up, down, or sideways?

Area Median List Price Median Sale to List Price Avg # of Offers Avg Down Payment # Homes Sold
Irvine

$759,000/

$424 per SF

98.3% 2.2 21.50% 728
Lake Forest $568,000/

$331 per SF

99.3% 1.1 12.30% 223
Tustin $635,000/

$355 per SF

98.60% 1.5 38.9% 165
Orange $599,000/

$326 per SF

98.8% 2.3 25.9% 339
Santa Ana $395,000/

$307 per SF

99.90% 1.8 14.70% 399
Costa Mesa $722,500/

$437 per SF

98.1% 2.0 20.8% 196
Newport Beach $2,300,000/

$932 per SF

96.8% 2.1 29.7% 358
Orange County $674,900/

$368 per SF

98.3% 2.3 20.5% 8,000

Source: redfin.com

Irvine—An Arbor Day Tree USA City

Trees help define the beauty and master-planning of our City….We love our trees.”—Irvine Mayor Steven Choi

“Trees are vital to the public infrastructure of cities and towns throughout the country, providing numerous environmental, social and economic benefits.”—Arbor Day Foundation

Did you know that Irvine is one of Arbor Day’s Tree Cities USA? With 23 years on the Tree City USA list, Irvine has been a Tree City USA for quite a few years.

So why should we care? Trees provide aesthetic value that adds to the enjoyment of a home or neighborhood and increase property values. In addition, they are the “lungs of the earth.” They take in carbon dioxide, which reduces pollution, and then give back oxygen, which, of course, we need to breathe. They also control dust and provide shade.

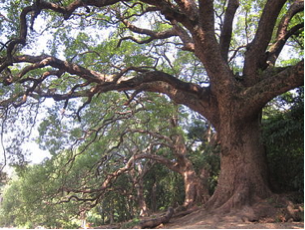
Irvine’s Official City Tree, the Camphor Tree, courtesy Wikipedia

“When a community becomes a Tree City USA, it means more than being able to display a road sign or fly the flag. Tree City USA is the basis for effective, well-organized tree care programs. Along with community pride are practical benefits such as helping to gain financial support for tree projects, contributing to safer and healthier urban forests and allowing municipal officials to deliver better service to the voting public.” –Tree City USA

The Arbor Day Foundation and the National Association of State Foresters have established four criteria for obtaining Tree City USA status. These four criteria require that cities or towns establish the following: Tree Board or Department, Tree Care Ordinance, Community Forestry Program With an Annual Budget of at Least $2 Per Capita, and an Arbor Day Observance and Proclamation.

Tip: Improper pruning can result in stress on trees that can lead to unhealthy and hazardous trees. To help in maintaining the value and safety of a home, click on the free link that the Arbor Day Association provides for proper pruning tips.

Note: To maintain the health, safety, and value of the trees owned by the City of Irvine, Irvine follows the International Society of Arboriculture (ISA) pruning standards, and the pruning is performed under the direct supervision of an ISA Certified Arborist. Some of the most popular City of Irvine trees are pines, sycamore, sweetgum, Crape Myrtle, and ficus.

Note: Orange County cities that have been on the list even longer than Irvine are Fullerton (32 years), Anaheim (29 years), Orange (24 years), and Cypress (24 years). Newport Beach ties with 23 years. Other Orange County cities on the Tree City USA list are Tustin (17 years), La Habra (15 years), Santa Ana (14 years), Huntington Beach (11 years)?, and Laguna Hills (7 years). The cities in California that have been on the Tree City USA list longest are Burbank and Sacramento (36 years each).—Arbor Day Foundation

Irvine Housing Overview: September 2013

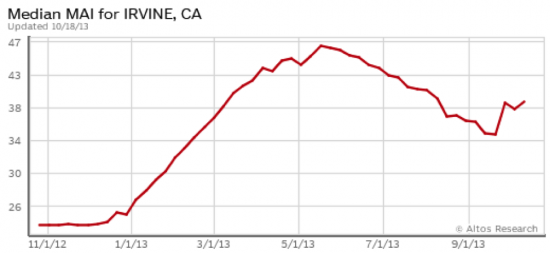
According to Altos Research, the Market Action Index (MAI)for Irvine’s single-family housing market was 39.12 on October 11. That is up from the 35.02 MAI that was recorded about a month ago. As defined by Altos, this puts the Irvine single-family housing market in the seller’s market category. (Above 30 is defined as a seller’s market; below is defined as a buyer’s market.) Altos also states that the average single-family home in Irvine has been on the market for about 64 days as of October 11, 2013.

Following is Irvine’s September 2013 housing market data as provided by Redfin.

Type

List Price/# Homes Listed

Sold Price/# Homes Sold

List Per SF

Sold Per SF

% Chg Y-O-Y Sold Price/SF

Houses

13-Sep

13-Aug

$1,099K/238

$1,075K/235

$920K/132

$908K/114

$462

$459

$423

$406

20.9%

17.70%

13-Jul

$1,125K/210

$900K/122

$459

$435

16.90%

13-Jun

$1,112K/186

$855K/99

$462

$414

16%

13-May

$1,030/167

$890/113

$457

$411

21.60%

13-Apr

n/a

n/a

n/a

n/a

n/a

13-Mar

$1,020K/101

$904K/62

$443

$381

13.40%

13-Feb

na/109

na/272

$415

$354

n/a

13-Jan

na/113

na/274

$409

$357

n/a

Condos

13-Sep

13-Aug

$585K/288

$590K/295

$520K/121

$564K/146

$398

$406

$395

$384

28.7%

24.30%

13-Jul

$588K/295

$522K/135

$416

$394

28.80%

13-Jun

$585K/235

$540K/130

$418

$391

24.90%

13-May

$599K/177

$539K/144

$406

$386

30.40%

13-Apr

n/a

n/a

n/a

n/a

n/a

13-Mar

$570K/111

$476K/88

$375

$344

21.60%

13-Feb

na/100

na/301

$369

$325

n/a

13-Jan

na/106

na/324

$377

$327

n/a

All

13-Sep

13-Aug

$724K/578

$710K/579

$710K/271

$660K/278

$415

$418

$408

$389

25.9%

18.20%

13-Jul

$709K/545

$659K/283

$423

$401

24.10%

13-Jun

$734K/456

$638K/249

$422

$395

20.80%

13-May

$750K/371

$659K/274

$416

$393

26.80%

13-Apr

n/a

n/a

n/a

n/a

n/a

13-Mar

$703K/219

$588K/151

$392

$359

18.90%

13-Feb

na/209

na/573

$389

$334

n/a

13-Jan

na/219

na/598

$389

$338

n/a

Irvine’s Most Popular Homes on the Market with Price Reductions

In my post last week, which highlighted three homes in Irvine’s most affordable category, I noted that 2 of these 3 homes had recent price reductions. Since many of the local news reports had been reporting on the multiple offers for homes that have been for sale recently, I started wondering if the tide is shifting and if reductions in other categories of the Irvine housing market were becoming less prevalent. So I took a look at the homes that Redfin has listed as the most popular in Irvine. I found that of the approximately 40 homes that Redfin currently lists in their most popularly viewed category, six have recent price reductions. Below is some information on these homes.

5 Whitewood Way

• $720,000 ($317 per square foot)

• 4 beds/2 baths (2,268 square feet)

• Attached home built in 1968

• University Park Neighborhood

• HOA: $185/month

• Mello Roos: none listed

Reduced September 29 from the original list price of $750,000

Note: Sale pending/back-up offers accepted as of October 12. Sold in February 2004 for $545,000.

3631 Claremont Street

• $769,000 ($320 per square foot)

• 5 beds/3.5 baths (2,400 square feet)

• Single-family home built in 1969

• Westpark Neighborhood

• HOA: $75/month

• Mello Roos: none listed

Reduced October 4 from the original list price of $795,000

Note: Sold on March 27, 2013 for $538,500

3 Atlanta

• $750,000 ($373 per square foot)

• Single-family home built in 1978

• 4 beds/2.5 baths (2,010 square feet)

• Northwood Neighborhood

• HOA: $65/month

• Mello Roos: none listed

• Reduced October 5 from the original list price of $839,000

Note: Sold on November 4, 2010 for $688,000

50 Eagle Point #27

• $439,900 ($374 per square foot)

• Single-family condominium built in 1978

• 3 beds/2 baths (1135 square feet)

• Woodbridge Neighborhood

• HOA: $336/month

• Mello Roos: none

• Reduced October 2 from the original list price of $449,900

Note: Sold on March 12, 2013 for $321,000

6 Bayfield

• $750,000 ($395 per square foot)

• Single-family home built in 1999

• 4 beds/3 baths (1900 square feet)

• Woodbridge Neighborhood

• HOA: $169/month

• Mello Roos: none

• Reduced September 25 from the original list price of $800,000

Note: Sold on October 29, 1999 for $319,090

202 Terra Bella

• $499,000 ($310 per square foot)

• Single-family condominium built in 2000

• 3 beds/2.25 baths (1610 square feet)

• Northpark Neighborhood

• HOA: $405/month

• Mello Roos: Yes

Reduced September 24 from the original list price of $529,000

Note: Sold on August 25, 1999 for $455,000