Category Archives: News

Housing and the City of Irvine 2012 Legislative Platform

Each year the city council approves a set of guidelines that will act as a guide for legislation advocacy in Sacramento. The City of Irvine 2012 Legislative Platform, which the city council approved in February, covers areas that are grouped under the headings of City Manager’s Office, Administrative Services, Community Development, Community Services, Orange County Great Park, Public Safety, and Public Works.

Since this is the Irvine Housing Blog, I am highlighting those items that relate to housing in the city of Irvine. The housing related items are listed under the heading of Community Development in the legislative platform. They are as follows:

A. Building Code

1. Support adoption of effective state building codes to promote community building safety and mitigation of natural hazards such as earthquakes and wildland fires.

2. Support adoption of effective and clear green building standards in the California Building Code.

3. Support adoption of accessibility standards in the California Building Code consistent with federal standards.

4. Support adoption of building construction related measures as part of the California Building Code rather than as separate stand-alone legislation.

5. Oppose measures diminishing the authority of local jurisdictions to enforce building codes or mandating the manner of enforcement with no provisions for local reimbursement.

B. Housing

1. Support housing measures that promote the development and enhancement of safe and decent affordable, sustainable, and accessible housing within the City, for all economic segments of the population.

2. Oppose legislation and measures diminishing the housing and community development authority of local elected officials.

3. Support measures that give local government the legislative authority to implement reasonable housing occupancy standards.

4. Support measures allowing local jurisdictions to pool resources in meeting sub-regional affordable housing goals.

5. Support housing bonds within State capacity limits to increase financial assistance to local governments, redevelopment agencies, nonprofit housing organizations and public/private partnerships to provide affordable, transitional, and emergency housing.

6. Support measures to establish regulations that increase the City’s ability to effectively compete for state and federal funding, such as Proposition 1C funds.

7. Support Federal legislation that would maintain or increase funds dedicated to the Community Development Block Grant Program and HOME program and supports the expansion of eligibility and allowable uses under this program.

8. Support housing legislation that creates and supports an equitable Regional Housing Needs Allocation [RHNA] process subject to a formal hearing and appeal process to ensure they are realistic, and that allows for cities to work together to allocate housing units among themselves within a subregion.

9. Support reforms to the housing element process that address potential conflicts between local growth projections and state regional housing need numbers, regional transportation plans, sustainable community strategies and resolve problems associated with the distribution of RHNA units within a council of governments.

10. Support legislation that permits self-certification of the City’s Housing Element.

11. Support housing legislation and regulation that allow non-profits and land trusts to broaden opportunities for and types of affordable homeownership.

C. Land Use Planning

1. Protect local land use planning authority; oppose efforts that would impose regional, state or federal growth, development or land use planning standards within the City.

2. Oppose legislation that diminishes the City’s discretionary ability to approve land use patterns and entitlement applications.

3. Support land use patterns that maintain safe residential neighborhoods, bolster economic prosperity, preserve open space, and enhance overall quality of life in Irvine.

4. Support efforts to strengthen the legal and fiscal capability of local agencies to prepare, adopt, and implement plans for orderly growth, development, beautification and conservation of local planning areas including, but not limited to, regulatory authority over zoning, subdivisions, and annexations.

D. Regional Governance/Growth Management

1. Support proposals encouraging regional, sub-regional, or countywide cooperation in planning urban development strategies, especially those that provide funding for effective implementation of agreed-upon goals.

2. Oppose legislation that mandates compliance between the City’s local land use authority and regional, sub-regional or countywide plans.

3. Oppose legislation or acquisition of land that would attempt to establish casino gambling-type operations within the City of Irvine.

4. Support measures to achieve fair and proportionate representation on countywide and regional boards.

5. Support policies promoting wildlife and habitat protection and enhancement, including endangered and threatened species, and sustainable economic development.

6. Support the fair and effective implementation of State infrastructure bonds, consistent with the needs of local cities.

7. Support funding for state and local investment in the physical infrastructure of California including, but not limited to, its roadways, bridges, levees, parks, libraries, and systems for delivering and treating water, wastewater, and storm water.

8. Support legislation that facilitates integration of the Housing Element, Regional Housing Needs Assessment, Regional Transportation Plan and Sustainable Communities Strategy for the Southern California region.

9. Support legislation to extend deadlines for local and regional compliance with the provisions of SB 375 and to align those deadlines with the next RHNA cycle.

10. Support follow up legislation to SB 375 to create clear, fair and equitable emission reduction goals that can realistically be achieved and which do not infringe upon local government land use authority.

11. Support funding and incentives for smart growth and sustainable development.
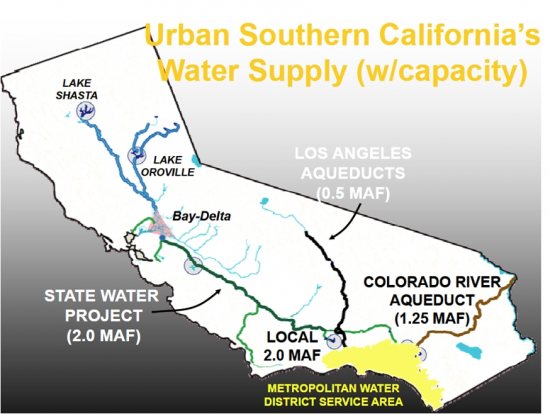
E. Water Supply

1. Support measures to increase water supply and improve drinking-water quality in this region.

2. Support measures that would increase funding for desalination and water reuse technologies, including support for the expansion of Groundwater Replenishment System project by the Orange County Water District and the Orange County Sanitation District to create new water supplies through recycling.

3. Support measures that permit the sale, lease, exchange or transfer of surplus water within the State, especially north to south, and agricultural-to-urban transfers.

4. Encourage the conservation of water resources, to the extent practical. Conservation programs among multiple agencies should be coordinated to maximize benefits.

F. Water Quality/Urban Runoff

1. Support regulations and legislation for water-quality improvements that are “watershed-based” and reflect state-of-the-art science, including cost-sharing studies with State and Federal agencies, including the U.S. Army Corps of Engineers.

2. Support policy development, funding, research, and implementation strategies based on scientific data and human/ecological risk assessment for addressing urban runoff.

Photo courtesy Southern California Association of Governments (SCAG)

Discuss below or on Talk Irvine.

Assemblymember Don Wagner on Reducing Your Water Bill

“A typical user uses more water outside than inside.”—Don Wagner

“Every day the average American pours, flushes, and sprinkles 40 to 130 gallons of water at home. Using simple conservation measures, that amount could be reduced by 14 to 39 gallons, or 30 percent. For 7 million customers, that’s a savings of 98 to 273 million gallons. .”—Irvine Ranch Water District

“The biggest segment of home water use goes to irrigation. Sprinklers, lawn and landscape irrigation. Anything we can do to cut back on that … those are some of the best things we can do. …

In the house, toilets and showers, those are the biggest ones. More efficient toilets, shorter showers, all the usual stuff.”—Jay Famiglietti, UCI Earth System Science professor

Last week I wrote that the Irvine Ranch Water District (IRWD) rates are increasing. That being the case, you might be interested in reducing your water usage. If so, following are some tips from a campaign flyer that Irvine’s California assembly member, Don Wagner, sent out before the election. Wagner’s tips are quoted directly from his campaign flyer. The comments in italics are mine.

Outside:

  • Water your lawn and plants for 15 minutes, 4 times a week. If you water during the heat of the day, you lose a lot to evaporation and plants won’t get the moisture they need. More plants actually die from over-watering than under-watering. If you water after dusk and before 5:00 a.m., you cut down on wasted water.

IRWD suggests a much shorter watering period and points out that your watering needs will increase and decrease with the seasons and weather (IRWD Watering Chart). Also make sure that your sprinklers are aimed properly so you’re not watering the sidewalk or driveway. Savings: 500 gallons/month

  • Use a broom to sweep up the sidewalk and driveway, rather than a hose. Savings: 150 gallons each time
  • Replace your garden with water-efficient plants. Savings: cuts usage in half

IRWD suggests using drip systems for your garden and shrubs. In addition, replacing your lawn as well as your garden (or part of your lawn) with water-efficient plants will reduce your water use. At one time, lawns were large enough that it was possible to play catch or some other activity in the yard. However, today most lawns in Irvine are not that large; so you might as well have a low-maintenance, water- thrifty yard.

Indoors:

  • While brushing your teeth, shaving, washing the cat, doing dishes, etc. shut the water off until you need it. Savings: 200-300 gallons/month
  • Fix plumbing joints and leaky faucets. Savings: 600 gallons/month
  • Run only full loads when washing clothes and dishes. Savings: 300-800 gallons/month
  • Reduce shower times by one of two minutes. Savings: 700 gallons/month
  • Install low flow showerheads. Savings: 500-800 gallons/month

IRWD also provides some tips on saving water in your home and yard. Since water is IRWD’s business, the IRWD tips tend to go into much more detail. In addition, IRWD provides a rebate list.

Note: IRWD serves homes and businesses that are located in Irvine, portions of the cities of Lake Forest, Portola Hills, Foothill Ranch, Newport Coast, Tustin Ranch, Newport Beach, Costa Mesa, Orange and portions of unincorporated Orange County

Related post: IRWD Helps Customers Save Water and Money,”

IRWD Water Rate Will Increase in July – Why?

“Over the past five years, imported water costs have increased approximately 65%.”—Orange County 2011 Community Indicators Report (http://www.ocsd.org/vgnfiles/ocgov/Community%20Investment/Docs/OCWIB/Calendar_Documents/2011CommunityIndicatorsB.pdf)

“Water is heavy (62.4 pounds per cubic foot) and tends to resist moving uphill. It takes a lot of energy to move water, but also to treat it, and then treat it again after we use it.”—19 Percent: The Great Water-Power Wake-Up Call,” KQED (http://blogs.kqed.org/climatewatch/2012/06/10/19-percent-californias-great-water-power-wake-up-call/)

“We’re also developing alternate waste supply strategies to further reduce the need for costly imported water.”—Beth Beeman, IRWD Director of Public Affairs

Starting July 1, rates for customers of the Irvine Ranch Water District (IRWD) will increase by .02cents per one hundred cubic feet of water. In addition, the service charge will increase by 55 cents. You might think that this is due to the recent snow pack level which was only 40% of normal. However, reports are stating that this year’s water supply is adequate since last year’s snow pack was well above normal.

So, if water supply is adequate, why are the water rates increasing? Approximately, two-thirds of the IRWD water is from local sources such as ground water wells, reservoirs, and recycled runoff. However, the other third is imported water that IRWD purchases from the Municipal Water District of Orange County (MWDOC). MWDOC purchases this water from Metropolitan Water District of Southern Californian (MWD). The infrastructure cost associated with this imported water is the primary reason given for the need to increase IRWD water bills.

MWD gets it water from the Colorado River or the State Water Project. The Colorado River aqueduct, which is needed to transport the Colorado River water to southern California, was built in 1939, and the State Water Project system, which transports water from the northern California delta and the Sierra snowmelt by means of the California aqueduct, is out of date. Both these systems are in need of infrastructure updating. For example, the bay delta system, which is just a portion of the State Water Project system, is anticipated to need an estimated $27.8 billion in retrofits.

In addition, IRWD is responsible for maintaining 1,500 miles of pipelines, 53 reservoirs, and two wastewater treatment plants. Over 40% of MWD facilities are over 60 years old and need repair or replacement. For example, Yorba Linda’s Diemer water treatment plant, built in 1963, and La Verne’s Weymouth treatment plant, completed in 1940, are scheduled for $143 million in retrofits in the next two years.

IRWD was criticized by a recent grand jury for holding too much money in reserves ($225 million). However, Beth Beeman, IRWD director of public affairs, said, “These are not reserves.” Beeman also said, “That money is designated for infrastructure maintenance and improvements that will be needed in the future. It’s like putting money away for your kid’s college. It’s there when you need it.”

Sources:

“Water rate hikes could be worst,” Tina Richards, Foothills Sentry (http://www.foothillssentry.com/)

Irvine Ranch Water District (IRWD) (http://www.irwd.com/)

Metropolitan Water District of Southern California (http://www.mwdh2o.com/mwdh2o/pages/yourwater/plants/weymouth01.html)

The Metropolitan Water District of Southern California, Robert B. Diemer Water Treatment Plant Update (http://www.mwdh2o.com/mwdh2o/pages/news/at_a_glance/New_DiemerFS.pdf)

Discuss below or on Talk Irvine.

Irvine Housing by the Numbers – June 2012 Update

Here is an updated list of the housing numbers for each of Irvine’s neighborhood. Of note, the Airport (IBC) area, Orange Tree, Shady Canyon, Turtle Ridge, Turtle Rock, University Park, University Town Center, Walnut, and Westpark have a year-over-year increase in the price per square foot for homes that sold in May in these areas. All other neighborhoods in Irvine had a decrease.

Overall Irvine’s May year-over-year price-per-square-foot selling price was down 4.6%.

Area List Price/# Homes Listed

Sold Price/# Homes Sold

List Per SF Sold Per SF % Chg Y-O-Y Sold Price/SF
Airport/IBC
12-May $459K/41 $514K/19 $356 $325 5.90%
12-Apr $442K/48 $340K/25 $350 $304 -5.90%
12-Mar $415K/45 $412K/16 $348 $346 11.60%
12-Feb $392K/48 $330K/15 $337 $288 -11.70%
12-Jan $374K/52 $327K/18 $332 $317 -17%
Columbus Grove n/a
El Camino
12-May $555K/19 $435K/19 $365 $280 -17.2%
12-Apr $572K/22 $458K/12 $329 $239 -22.10%
12-Mar $546K/22 $468K/10 $329 $327 3.80%
12-Feb $467K/26 $340K/5 $339 $281 -6.60%
12-Jan $462K/28 $389K/6 $322 $267 -28.40%
Northpark
12-May $700K/59 $438K/35 $329 $278 -7.3%
12-Apr $649K/51 $390K/29 $339 $283 -10.04
12-Mar $674K/50 $465K/36 $341 $281 -8.80%
12-Feb $459K/74 $415K/13 $301 $280 -9.40%
12-Jan $465K/91 $412K/19 $290 $277 -20.90%
Northwood
12-May $697K/52 $584K/32 $314 $267 -13%
12-Apr $599K/59 $579K/30 $312 $310 5.10%
12-Mar $519K/61 $518K/20 $316 $301 -1.60%
12-Feb $504K/66 $292K/13 $300 $287 -7.10%
12-Jan $489K/78 $518K/17 $286 $292 -7.60%
Oak Creek
12-May $579K/17 $240K/8 $333 $281 -1.7%
12-Apr $530K/19 $628K/14 $303 $315 5.90%
12-Mar $425K/27 $284K/14 $309 $292 -1.40%
12-Feb $487K/26 $267K/13 $317 $267 -15.80%
12-Jan $350K/33 $249K/9 $308 $261 -20.40%
Orange Tree
12-May $280K/3 $145K/2 $307 $261 6.1%
12-Apr $278K/6 $165K/1 $256 $203 -31.90%
12-Mar $245K/9 $189K/6 $253 $279 4.10%
12-Feb $242K/6 $200K/6 $249 $230 -33.50%
12-Jan $216K/12 $205K/5 $252 $249 -13.50%
Portola Springs
12-May $660K/23 $582K/13 $335 $284 -4.10%
12-Apr $693K/30 $596K/11 $330 $299 -11%
12-Mar $639K/25 $950K/5 $325 $320 11.90%
12-Feb $641K/31 $510K/1 $317 $249 -12%
12-Jan $623K/43 $570K/7 $321 $293 1.40%
Quail Hill
12-May $714K/18 $465K/13 $376 $347 -13.0%
12-Apr $749K/17 $863K/6 $373 $374 7.50%
12-Mar $500K/21 $505K/9 $360 $317 -3.10%
12-Feb $515K/21 $470k/6 $364 $307 -10.80%
12-Jan $560K/20 $512K/8 $324 $326 -13.30%
Rancho San Joaquin
12-May $475K/5 $410K/2 $313 $306 -2%
12-Apr n/a
12-Mar $465K/5 $500K/2 $246 $296 n/a
12-Feb $492K/6 $360K/1 $297 $336 n/a
12-Jan n/a
Shady Canyon
12-May $6,000K/25 $4,019K/6 $705 $673 30.70%
12-Apr $5,995K/23 $4,875K/4 $720 $512 -6.10%
12-Mar $5,980K/21 $4,436K/4 $720 $657 28.80%
12-Feb $5,995K/23 $3,200K/3 $725 $603 7.50%
12-Jan $5,980K/23 $2,670K/5 $720 $534 24.20%
Turtle Ridge
12-May $1,749K/31 $1,044K/8 $545 459 0.101
12-Apr $1,724K/28 na/8 $533 $421 5.20%
12-Mar $1,899K/28 $1,500K/7 $550 $485 -8.30%
12-Feb $1,899K/27 $955K/4 $527 $441 18.90%
12-Jan $1,672K/32 $532K/4 $493 $355 -25.30%
Turtle Rock
12-May $939K/37 $730K/9 $454 $410 3.3%
12-Apr $986K/43 $1,050K/5 $457 $461 10.30%
12-Mar $967K/40 $690K/11 $448 $381 17.60%
12-Feb $1,024K/38 $1,422K/4 $457 $559 14.30%
12-Jan $974K/40 $545K/8 $458 $295 -14.20%
University Park
12-May $602K/12 $539K/8 $346 $291 6.20%
12-Apr $609K/11 $538K/7 $352 $272 -15%
12-Mar $552K/14 $431K/6 $288 $305 -5.60%
12-Feb $578K/14 $555K/4 $297 $286 9.60%
12-Jan $595K/14 $420K/7 $289 $281 -10.80%
University Town Center
12-May $440K/5 $450K/5 $371 $311 6.90%
12-Apr $340K/3 $375K/5 $338 $326 6.90%
12-Mar $455K/7 $478K/4 $298 $321 1.90%
12-Feb $347K/6 $384K/1 $342 $265 -19.50%
12-Jan $467K/10 $480K/1 $330 $315 n/a
Walnut
12-May $628K/5 $595K/5 $309 $314 14.6%
12-Apr $532K/3 $580K/5 $313 $306 -1%
12-Mar $619K/5 $635K/3 $327 $300 3.40%
12-Feb $600K/5 $509K/3 $316 $310 -9.40%
12-Jan $600K/11 $596K/4 $298 $259 -12.80%
West Irvine n/a
Westpark
12-May $628K/5 $595K/5 $309 $314 14.60%
12-Apr $624K/14 $651K/8 $360 $304 -10.30%
12-Mar $565K/17 $615K/10 $319 $331 -2.50%
12-Feb $649K/21 $506K/6 $319 $361 21.50%
12-Jan $552K/20 $695K/2 $331 $356 -11.20%
Woodbridge
12-May $586K/50 $430K/25 $350 $307 -6.40%
12-Apr $554K/68 $422K/29 $347 $289 -8%
12-Mar $494K/68 $345K/31 $339 $283 -9.30%
12-Feb $459K/83 $399K/23 $328 $312 -4.90%
12-Jan $435K/93 $402K/15 $317 $273 -6.20%
Woodbury
12-May $872K/24 $650K/11 $363 $310 -3.40%
12-Apr $784K/30 $475K/14 $357 $291 -9.30%
12-Mar $680K/35 $678K/21 $334 $289 0%
12-Feb $650K/33 $419K/8 $330 $298 -4.70%
12-Jan $611K/44 $460K/8 $314 $292 -16.80%

Source: Redfin.com

Discuss below or on Talk Irvine.

Affordable Housing in Irvine

Last week I wrote about the effect that lack of the redevelopment money would have on the build out of the Orange County Great. But the question also came up on what effect the lack of redevelopment funds would have on building affordable housing in Irvine. So today’s post is a brief look at affordable housing in Irvine.

As I wrote last week, “[R]edevelopment funds are a relatively new invention in Irvine. The redevelopment district was built to aid with the development of the Orange County Great Park. Redevelopment money generated from this redevelopment district was to be used for the Great Park development”. This means that redevelopment funds have never been an important source for building affordable housing in Irvine. Instead, as the housing element chart for affordable rental units built in Irvine shows, other means were used [See the Funding Source(s) column in the chart found below.]. These include bonds, grants, loans, and tax credits. These various options might be from federal, state, county, or city governments. In addition, developer funding, deferred developer fees, and partnerships with developers are sometimes used. The city partnerships with developers includes partnerships with The Irvine Company as well as non-profit developers such as Jamboree Housing, Bridge Housing, and Irvine Housing Opportunities, Inc. In addition, with the goal of providing ownership of permanent affordable housing as well as affordable rental housing in Irvine, the city started the Irvine Community Land Trust in 2005.

Recently, the city council approved without changes the action plan for the federal Community Development Block Grant (CDGB) and the HOME Investment Partnership Program that the Irvine Community Service Commission recommended. The Irvine Community Service Commission recommended various organizations to receive these funds. However, five organizations that applied were not recommended; limited funds were stated as a reason.

City of Irvine C-46 Housing Element General Plan

Table C-32: Affordable Housing Developments

Project Name Type Total Units Assisted Units/ Income Level Unit Size Funding Source(s) Earliest Date of Conversion
Turtle Rock Canyon Family 217 66 very low and low income units 1, 2, 3 BR 1998 CSCDA Series A Bond 2044
Dartmouth Court Family 294 89 very low and low income units 1 and 2 BR 1998 CSCDA Series A Bond 2044
Villa Sienna Family 1,442 216 very low, low, and moderate income units Studio, 1, 2, 3 BR 1998 CSCDA Series PP Multi-Family Bond 2047
Toscana Apartments Family 562 84 very low and low income units Studio, 1, 2 BR 1990 Series B County Bond 2046
Inn at Woodbridge Senior 116 116 very low and low income units 1 and 2 BR Tax Credits, City of Irvine CDBG 2050
Santa Alicia Family 86 86 very low and low income units 1, 2, 3, 4 BR 1998 CSCDA Series A Bond, Tax Credits 2052
San Paulo Villas Family 382 173 very low, low, and moderate income units 1, 2, 3 BR 1998 CSCDA Series A Bond, City of Irvine CDBG, County of Orange 2023
Montecito Vista Family 162 160 extremely low, very low, and low income units 2 and 3 BR City of Irvine HOME & CDBG, County of Orange HOME & Redevelopment, OC Apartment Development Revenue Bonds, Low Income Housing Tax Credit 2061
Windrow Apartments Family 96 96 extremely low and very low income units 1, 2, 3 BR City of Irvine HOME & Workforce Housing Grant, County of Orange 2060
Laguna Canyon Family 120 120 very low income units 1, 2, 3 BR Tax Exempt Bond, County Tax Credits, CalHFA Bridge Loan, 9% Tax Credit Financing, OC Housing Authority 2061
Columbus Grove Family 527 27 very low and low income units 1, 2, 3 BR City of Irvine CalHOME, CDBG & ADDI 2037
Woodbury Walk Family 150 150 very low income units 1,2,3 BR City CDBG & HOME, 9% LIHTC Tax Credit, OCDA Set Aside, OC Strategic Priority Affordable Housing Funds 2064
Kelvin Court Family 132 27 very low income units Studio, 1, 2, & 3 BR Developer financed 2061
Granite Court Family 71 71 extremely low and very low income units 1,2, & 3 BR Tax exempt bonds, CA Multi-Family Housing Revenue Bond, CA Multi-Family Housing Loan Program, County of Orange HCS, City of Irvine, , deferred developer fee 2106
The Arbor at Woodbury Family 90 90 extremely low, very low and low income units 1,2,&3 BR City CDBG & HOME, County Housing Development, the Irvine Company 2107
Avalon Irvine Family 280 23 very low income units 1 & 2 BR Developer funded 2037
Axis 2300 Family 115 18 low income units 2 BR Developer funded 2040

Source: City of Irvine, 2011

This concludes our brief look at affordable housing in Irvine-perhaps more on this at another time

Discuss below or on Talk Irvine.