Category Archives: News

A Closer Look at Irvine's University Park Housing Market

Today we will take a look at Irvine’s University neighborhood. First, a quick observation: Like many of Irvine’s neighborhoods, University Park’s price per square foot selling price shows no consistent pattern of increase or decrease when compare to the same month last year.

Now, the numbers: University Park—September 2012:

Area List Price/# of Homes Listed Sold Price/ #Homes Sold Median List/SF Median Sold/SF % Chg Y-O-Y Sold Price/SF
Houses $675K/9 $620K/9 $324 $313 -8.70%
Condos $575K/2 $515K/1 $336 $355 9.6%
All University Park $660K/11 $594K/10 $324 $323 -5%
All Irvine $750K/381 $530K/210 $365 $323 1.90%

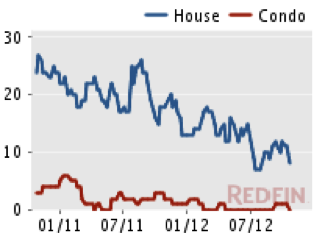
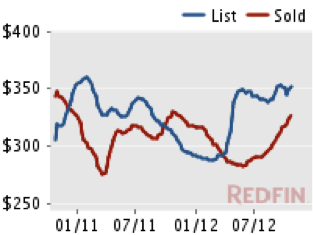
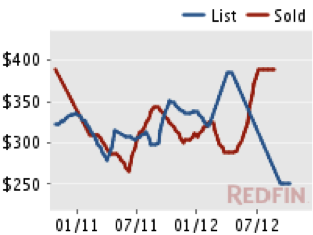
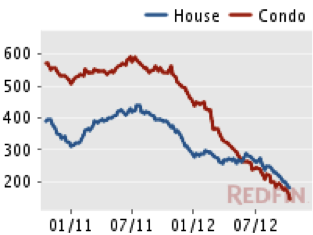
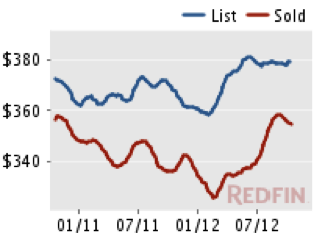
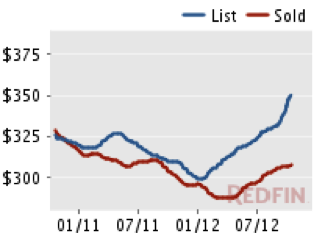
The following graphs show the change in the number of University Park homes on the market (inventory), the price per square foot of University Park houses, and the price per square foot of University Park condos, respectively.

To give more meaning to these numbers and graphs, I am listing some homes that are near the bottom, top, and middle of the price range for homes in the University Park real estate market.

Note: A quick scan of the University Park listings shows that many of these homes are “sale pending.”

4042 Germainder Way

  • Single-family built in 1968
  • Beds/Baths: 3/2 (1,495 sf)
  • HOA Dues: $123/month
  • Mello Roos Tax: No
  • Price: $454,900/$304 per square foot

2 Angell

  • Single-family built in 2008
  • Beds/Baths:5/4 (3,850sf)
  • HOA Dues: $123/month
  • Mello Roos Tax: No
  • Price: $1,495,000/$388 per square foot

10 Senisa

  • Single-family built in 1966
  • Beds/Baths:3/2.5 (1,741 sf)
  • HOA Dues: $179/month.
  • Mello Roos Tax: No
  • Price: $599,500/$344 per square foot

Source: Redfin

Closed Sales from 10/18/2012 to 10/25/2012

Date Sold Address Zip Tract Sold Price Beds Sq Ft
Columbus Grove
10/19/12 27 Juneberry 92606 Kensington Court $570,000 3 2125
El Camino Real
10/23/12 3 Saint Paul 11 92604 Heritage Park $400,000 3 1223
10/25/12 5 Greenwood 92604 Smoketree $389,000 3 1517
10/22/12 4121 Fireside Cir 92604 Greentree $600,000 3 1800
Northpark
10/22/12 6 Riveroaks 92602 Rutherford $830,000 3 2200
10/22/12 20 Inglenook 92602 Campanile $875,000 3 2460
10/25/12 19 Delano 92602 Bel Aire $935,000 5 3097
Northwood
10/18/12 37 New Dawn 92620 RoseGate $2,200,000 5 4800
10/18/12 23 Ericson Aisle 92620 Northwood Villas $404,900 2 1279
10/18/12 12 Calandria 92620 Orchard Glen NW $590,000 3 1414
10/19/12 2 Mansfield Dr 92620 Mahogany $2,010,000 5 5200
10/22/12 6 Christamon W 92620 Park Place $750,000 4 2336
10/24/12 8 Leesburg 92620 Glen (NW) $553,500 3 1424
10/25/12 9 Garnet 92620 Somerton $1,400,000 5 3700
Oak Creek
10/19/12 19 Medlar 92618 Kenwood $979,000 5 3123
10/19/12 52 Danbury Ln 92618 Cobblestone $555,000 3 1500
Orangetree
10/22/12 140 Tangelo 92618 Lake Condos $280,000 2 994
Portola Springs
10/19/12 46 Wild Trails 92618 Ironwood $578,990 3 2092
Quail Hill
10/19/12 79 Windchime 92603 Sage $520,000 3 1300
Rancho San Joaquin
10/22/12 36 Navarre 139 92612 RSJ Villas $388,000 2 1145
Turtle Ridge
10/18/12 56 Shade Tree 92603 Canyon's Edge $942,000 2 2330
10/22/12 216 Coral Rose 92603 Ashton Green $460,000 2 1181
Turtle Rock
10/19/12 49 HIGHLAND VIEW 29 92603 Highlands Townhomes $462,500 2 1369
10/22/12 10 Windflower 92603 Highlands Garden $1,250,000 4 2956
10/24/12 36 Black Hawk 92603 Shady Canyon Custom $3,500,000 4 5500
10/25/12 16 Bluff View 92603 Highlands Lusk $1,955,000 5 4366
University Park
10/19/12 2 Mimosa 92612 Terrace $580,000 3 1539
University Town Center
10/19/12 33 Auburn Aisle 92612 Oxford Court $370,000 2 1019
10/19/12 10 Menlo Aisle 159 92612 Oxford Court $435,000 2 1350
Walnut
10/22/12 3891 Blackthorn Street 92606 College Park $605,000 4 1873
10/23/12 25 New Jersey 92606 Revere $694,900 4 2100
West Irvine
10/23/12 71 Glen Arbor 126 92602 Wisteria $570,000 4 1730
10/23/12 83 Sorenson 92602 Wisteria $470,000 2 1220
Westpark
10/18/12 10 Almador 92614 Las Palmas $480,000 3 1486
10/19/12 90 Costero Aisle 284 92614 Tiempo $370,000 2 1107
10/23/12 10 Cosenza 92614 Vista West Park $730,000 4 1950
10/24/12 1 Santa Catalina Aisle 92606 Ravenna $650,000 4 1900
Woodbridge
10/18/12 166 W Yale Loop 92604 Estates $418,000 3 1900
10/18/12 18 Woodsorrel 92604 Creekside $750,000 4 2044
10/19/12 18 Springwater 66 92604 Townhomes $450,000 2 1120
10/19/12 49 Rushingwind 29 92614 Willow Creek (WB) $725,000 3 2186
10/19/12 31 Orangegrove 92604 Grove $559,900 2 1495
10/22/12 6 Thicket #63 92614 Woodbridge Reserve $338,000 2 1098
10/24/12 34 Sparrowhawk 92604 Villager $313,000 3 1212
Woodbury
10/23/12 33 Hallmark 92620 La Casella $605,000 3 2090
10/23/12 32 Roycroft 92620 La Casella $830,000 4 2643

Discuss on Talk Irvine: http://www.talkirvine.com/index.php/topic,3235.0.html

Irvine House vs Condo Numbers: October 2012

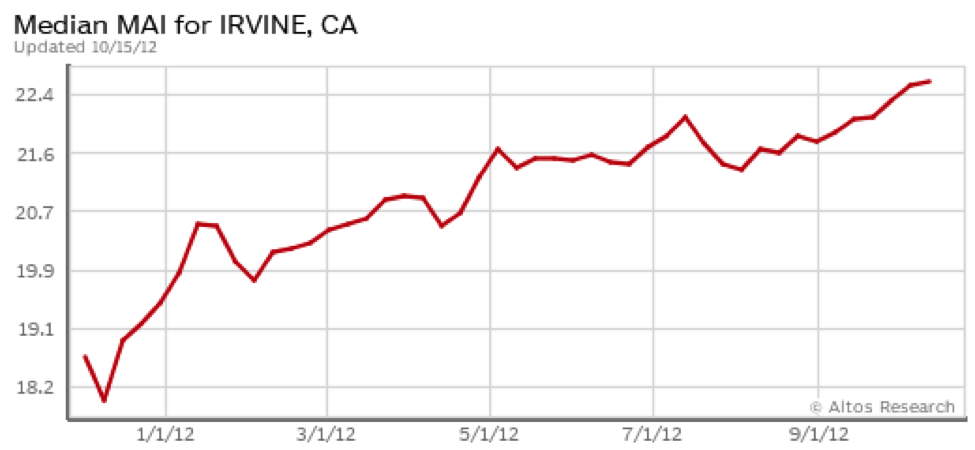
According to Altos Research, Irvine’s single-family housing market is nearly the same as it was the previous month. Altos gives Irvine’s single-family homes a Market Action Index of 22.58, which Altos defines as a buyer’s market. (Above 30 is defined as a seller’s market; below is defined as a buyer’s market.) Altos also states that the average single-family home has been on the market for about 112 days as of October 12, 2012.

Altos Market Action Index for Single-family Homes in Irvine

Altos Research

Following is data from Redfin, on Irvine’s September 2012 housing market:

Type List Price/# Homes Listed Sold Price/# Homes Sold List Per SF Sold Per SF % Chg Y-O-Y Sold Price/SF
Houses
12-Sep $958K/205 $690K/91 $375 $346 0.90%
12-Aug $960K/221 $710K/125 $380 $345 -0.30%
12-Jul $949K/226 $760K/95 $382 $368 7.90%
12-Jun $890K/251 $735K/103 $384 $356 5%
Condos
12-Sep $542K/174 $430K/118 $352 $307 1.70%
12-Aug $525K/168 $427K/141 $338 $306 0%
12-Jul $509K/181 $425K/115 $342 $306 -1.60%
12-Jun $498K/202 $430K/152 $336 $313 -1.30%
All
12-Sep $750K/381 $530K/210 $365 $323 1.90%
12-Aug $736K/390 $536K/267 $362 $328 3.50%
12-Jul $744K/408 $545K/211 $363 $322 0.30%
12-Jun $720K/456 $515K/257 $363 $327 0.90%

Note:

· The September 2012 overall median selling price was up 6% from the previous year.

· The August 2012 overall median selling price was down 0.6% from the previous year.

The following charts show Irvine’s inventory, median price per square foot of houses, and median price per square foot of condos, respectively.

Redfin

If you would like to see some housing numbers for each of Irvine’s neighborhoods, see my previous post “Irvine Housing by the Numbers – October 2012 Update.”

Closed Sales from 10/11/2012 to 10/17/2012

Date Sold Address Zip Tract Sold Price Beds Sq Ft
Airport Area
10/11/12 2354 Watermarke Pl 92612 Watermarke $250,000 1 842
10/15/12 2357 Watermarke Place 92612 $269,000 1 844
10/17/12 21 Gramercy 92612 Belvedere $675,759 2 1770
El Camino Real
10/11/12 6 Santa Fe 92604 Heritage Park $425,000 3 1639
10/11/12 5042 Kron 92604 Ranch $645,000 4 2500
Northpark
10/11/12 35 Bella Rosa 92602 Rutherford $870,000 3 2600
10/11/12 36 Malibu 92602 Huntington Collection $1,315,000 4 3500
10/15/12 76 Burlingame 92602 Brisbane $450,000 2 1670
10/15/12 14 Evensen 92602 Vintners Reserve $630,000 3 1858
10/15/12 8 Del Mar 92602 Tiburon $575,000 3 1601
10/17/12 10 Zuma 9 92602 Vintners Reserve $690,000 3 2400
Northwood
10/11/12 95 Huntington 92620 Horizon $258,000 2 1016
10/12/12 29 Wedgewood 92620 Lexington I $950,000 5 2680
10/15/12 19 Colonial 92620 Woodside II $660,000 3 1884
10/15/12 8 Buchanan 92620 Courtside $660,000 4 2200
10/15/12 127 Cartier Aisle 92620 Northwood Villas $388,800 2 1279
10/16/12 29 Rossano 92620 Vista Filare $499,000 2 1425
10/17/12 6 E Trenton 92620 Woodcrest $908,000 4 2965
10/17/12 15 Columbus 92620 Northwood Place $640,000 3 1780
Oak Creek
10/11/12 3508 Aspen Grv 92618 Oak Park $228,000 1 900
10/15/12 6 Medlar 92618 Kenwood $930,000 4 3150
10/17/12 10 Lavender 92618 Cypress $752,000 4 2050
Portola Springs
10/16/12 33 Canoe 92618 Ironwood $570,000 3 2092
Quail Hill
10/12/12 258 Dewdrop 92603 Jasmine $410,000 2 1330
Rancho San Joaquin
10/15/12 8 Viejo 92612 RSJ Townhomes $514,000 3 1819
Turtle Ridge
10/11/12 17 SHADE TREE 92603 Canyon's Edge $840,000 2 2000
10/15/12 35 Tall Hedge 92603 Ledges $1,750,000 4 2825
Turtle Rock
10/12/12 31 Morning Glory 92603 Ridge Townhomes Peters $1,040,000 3 2700
10/12/12 5 Starlight 92603 Ridge – Irvine Pacific $869,900 3 1973
10/12/12 24 Morning Breeze 92603 Ridge Garden Homes $655,000 2 1568
10/15/12 23 Highland Vw 15 92603 Highlands Townhomes $515,000 2 1600
University Park
10/12/12 16 Tahoe 92612 Park Crest $531,000 2 1540
10/15/12 21 Chicory Way 92612 Hanover $541,000 3 1493
10/15/12 29 Acacia Tree Ln 92612 Village III (Village Park) $540,000 3 1560
10/15/12 20 Gillman St 92612 Chancellor $625,000 3 1684
Walnut
10/11/12 27 NEW JERSEY 92606 Revere $710,000 5 2200
10/12/12 213 Kensington Park 22 92606 0 $430,000 3 1700
10/15/12 7 Georgia 92606 Harvard Square $689,000 5 2185
West Irvine
10/11/12 7 Calais 92602 Concord $850,000 5 3103
10/11/12 60 Autumn 92602 Summerplace $552,000 3 1905
Westpark
10/11/12 19 Las Cruces 92614 Vista West Park $690,000 3 1821
10/15/12 403 Tropea Aisle 92606 Brio $358,900 2 1028
Woodbridge
10/11/12 59 Lakeview 22 92604 Arborlake $860,000 3 2044
10/12/12 388 E Yale Loop 1 92614 Garden Estates $430,000 2 1323
10/17/12 73 Weepingwood 40 92614 Parkview $365,000 2 1132
Woodbury
10/16/12 50 TALISMAN 92620 Santa Barbara $415,000 2 1165
10/15/12 106 Peony 92618 Monterey $600,000 3 1878

Discuss on Talk Irvine: http://www.talkirvine.com/index.php/topic,3214.0.html

Irvine Housing by the Numbers – October Update

Here is an updated list of the housing numbers for each of Irvine’s neighborhood. Woodbury is still notable for having mostly year-over-year decreases this year. And after a mostly upward yearly trend, Turtle Rock has a 19% decrease in the year-over-year price per square foot.

Area

List Price/# Homes Listed

Sold Price/# Homes Sold

List Per SF

Sold Per SF

% Chg Y-O-Y Sold Price/SF

Airport/IBC

12-Sep

12-Aug

12-Jul

12-Jun

12-May

$787K/42

$520K/23

$594K/27

$511K/32

$459K/41

$370K/16

$431K/23

$468K/18

$328K/30

$514K/19

$399

$382

$406

$380

$356

$326

$328

$312

$312

$325

2.2%

13.5%

1%

-3.4%

5.90%

12-Apr

$442K/48

$340K/25

$350

$304

-5.90%

12-Mar

$415K/45

$412K/16

$348

$346

11.60%

12-Feb

$392K/48

$330K/15

$337

$288

-11.70%

12-Jan

$374K/52

$327K/18

$332

$317

-17%

Columbus Grove

n/a

El Camino

12-Sep

12-Aug

12-Jul

12-Jun

12-May

$540K/18

$600K/21

$624K/10

$579K/24

$555K/19

$399/19

$490/21

$455K/9

$504K/13

$435K/19

$380

$359

$408

$392

$365

$272

$334

$359

$327

$280

-21.4%

-7%

16.6%

16%

-17.2%

12-Apr

$572K/22

$458K/12

$329

$239

-22.10%

12-Mar

$546K/22

$468K/10

$329

$327

3.80%

12-Feb

$467K/26

$340K/5

$339

$281

-6.60%

12-Jan

$462K/28

$389K/6

$322

$267

-28.40%

Northpark

12-Sep

12-Aug

12-Jul

12-Jun

12-May

$870K/37

$809K/48

$844K/48

$774K/50

$700K/59

$460K/25

$488K/40

$540K/31

$460K/35

$438K/35

$333

$333

$348

$351

$329

$298

$289

$289

$297

$278

2.1%

-2.7%

-10%

1.4%

-7.3%

12-Apr

$649K/51

$390K/29

$339

$283

-10.04

12-Mar

$674K/50

$465K/36

$341

$281

-8.80%

12-Feb

$459K/74

$415K/13

$301

$280

-9.40%

12-Jan

$465K/91

$412K/19

$290

$277

-20.90%

Northwood

12-Sep

12-Aug

12-Jul

12-Jun

12-May

$777K/44

$735K/51

$727K/52

$692K/62

$697K/52

$518K/26

$612K/38

$650K/22

$525K/27

$584K/32

$341

$322

$323

$316

$314

$314

$317

$340

$295

$267

4.7%

7.1%

9%

-8.1%

-13%

12-Apr

$599K/59

$579K/30

$312

$310

5.10%

12-Mar

$519K/61

$518K/20

$316

$301

-1.60%

12-Feb

$504K/66

$292K/13

$300

$287

-7.10%

12-Jan

$489K/78

$518K/17

$286

$292

-7.60%

Oak Creek

12-Sep

12-Aug

12-Jul

12-Jun

12-May

$542K/16

$644K/16

$576K/12

$720K/19

$579K/17

$476K/8

$433K/16

$338K/12

$216K/10

$240K/8

$351

$328

$330

$330

$333

$310

$327

$288

$216

$281

-0.6%

-3.5%

-10.6%

-21.1%

-1.7%

12-Apr

$530K/19

$628K/14

$303

$315

5.90%

12-Mar

$425K/27

$284K/14

$309

$292

-1.40%

12-Feb

$487K/26

$267K/13

$317

$267

-15.80%

12-Jan

$350K/33

$249K/9

$308

$261

-20.40%

Orange Tree

12-Sep

12-Aug

12-Jul

12-Jun

12-May

$280K/6

$320K/3

$257K/2

$250K/3

$280K/3

0

$184K/2

$279K/4

$181K/6

$145K/2

$356

$289

$311

$307

$307

n/a

$214

$265

$251

$261

n/a

-41.5%

-23%

-10%

6.1%

12-Apr

$278K/6

$165K/1

$256

$203

-31.90%

12-Mar

$245K/9

$189K/6

$253

$279

4.10%

12-Feb

$242K/6

$200K/6

$249

$230

-33.50%

12-Jan

$216K/12

$205K/5

$252

$249

-13.50%

Portola Springs

12-Sep

12-Aug

12-Jul

12-Jun

12-May

$639K/22

$640K/26

$639K/33

$622K/31

$660K/23

$621K/13

$571K/11

$631K/12

$724K/8

$582K/13

$319

$324

$325

$321

$335

$322

$283

$317

$308

$284

1.3%s

-5.4%

1%

-4%

-4.10%

12-Apr

$693K/30

$596K/11

$330

$299

-11%

12-Mar

$639K/25

$950K/5

$325

$320

11.90%

12-Feb

$641K/31

$510K/1

$317

$249

-12%

12-Jan

$623K/43

$570K/7

$321

$293

1.40%

Quail Hill

12-Sep

12-Aug

12-Jul

12-Jun

12-May

$625K/15

$630K/15

$625K/13

$647K/14

$714K/18

$450K/7

$600K/12

$885K/8

$586K/12

$465K/13

$384

$392

$361

$373

$376

$325

$392

$389

$375

$347

-3.8%

11.4%

21.6%

8.1%

-13.0%

12-Apr

$749K/17

$863K/6

$373

$374

7.50%

12-Mar

$500K/21

$505K/9

$360

$317

-3.10%

12-Feb

$515K/21

$470k/6

$364

$307

-10.80%

12-Jan

$560K/20

$512K/8

$324

$326

-13.30%

Rancho San Joaquin

12-Sep

12-Aug

12-Jul

12-Jun

12-May

$485K/3

$449K/4

$509K/3

n/a

$475K/5

$495K/2

$460K/3

$433K/2

$410K/2

$346

$339

$320

$313

$336

$307

$269

$306

13.9%

-9.7%

-6.3%

-2%

12-Apr

n/a

12-Mar

$465K/5

$500K/2

$246

$296

n/a

12-Feb

$492K/6

$360K/1

$297

$336

n/a

12-Jan

n/a

Shady Canyon

12-Sep

12-Aug

12-Jul

12-Jun

12-May

$6,142K/24

$6,922K/26

$6,000K/27

$5,998K/26

$6,000K/25

$4,390K/2

$3,124K/4

$4,555K/3

$3,700K/3

$4,019K/6

$752

$770

$760

$761

$705

$748

$561

$586

$552

$673

19.7%

-3.9%

15.4%

-10%

30.70%

12-Apr

$5,995K/23

$4,875K/4

$720

$512

-6.10%

12-Mar

$5,980K/21

$4,436K/4

$720

$657

28.80%

12-Feb

$5,995K/23

$3,200K/3

$725

$603

7.50%

12-Jan

$5,980K/23

$2,670K/5

$720

$534

24.20%

Turtle Ridge

12-Sep

12-Aug

12-Jul

12-Jun

12-May

$1,750K/19

$1,825K/21

$1,848K/25

$1,875K/27

$1,749K/31

$1,875K/8

$1,950K/9

$1,440K/12

$1,360K/11

$1,044K/8

$589

$567

$571

$570

$545

$525

$504

$510

$467

$459

9.1%

22%

14.9%

4.7%

0.10%

12-Apr

$1,724K/28

na/8

$533

$421

5.20%

12-Mar

$1,899K/28

$1,500K/7

$550

$485

-8.30%

12-Feb

$1,899K/27

$955K/4

$527

$441

18.90%

12-Jan

$1,672K/32

$532K/4

$493

$355

-25.30%

Turtle Rock

12- Sep

12-Aug

12-Jul

12-Jun

12-May

$812K/24

$825K/27

$837K/32

$865K/37

$939K/37

$790K/10

$932K/14

$975K/10

$915K/20

$730K/9

$396

$399

$421

$457

$454

$406

$465

$451

$446

$410

-19%

14.8%

19.3%

3.2%

3.3%

12-Apr

$986K/43

$1,050K/5

$457

$461

10.30%

12-Mar

$967K/40

$690K/11

$448

$381

17.60%

12-Feb

$1,024K/38

$1,422K/4

$457

$559

14.30%

12-Jan

$974K/40

$545K/8

$458

$295

-14.20%

University Park

12- Sep

12-Aug

12-Jul

12-Jun

12-May

$660K/11

$631K/8

$699K/7

$599K/12

$602K/12

$594K/10

$520K/12

$560K/5

$540K/10

$539K/8

$324

$359

$331

$345

$346

$323

$333

$312

$333

$291

-5%

6.1%

-9%

6.4%

6.20%

12-Apr

$609K/11

$538K/7

$352

$272

-15%

12-Mar

$552K/14

$431K/6

$288

$305

-5.60%

12-Feb

$578K/14

$555K/4

$297

$286

9.60%

12-Jan

$595K/14

$420K/7

$289

$281

-10.80%

University Town Center

12- Sep

12-Aug

12-Jul

12-Jun

12-May

$489K/2

$355K/3

$435K/10

$440K/7

$440K/5

$365K/5

$411K/4

$430K/6

$295K/2

$450K/5

$393

$399

$368

$384

$371

$344

$333

$316

$322

$311

13.9%

9.9%

-10%

17.1%

6.90%

12-Apr

$340K/3

$375K/5

$338

$326

6.90%

12-Mar

$455K/7

$478K/4

$298

$321

1.90%

12-Feb

$347K/6

$384K/1

$342

$265

-19.50%

12-Jan

$467K/10

$480K/1

$330

$315

n/a

Walnut

12- Sep

12-Aug

12-Jul

12-Jun

12-May

$582K/8

$630K/8

$626K/14

$659K/5

$628K/5

$597K/6

$575K/4

$528K/1

$540K/5

$595K/5

$340

$330

$330

$307

$309

$298

$303

$321

$280

$314

2.4%

-1.3%

-4.2%

-9.4%

14.6%

12-Apr

$532K/3

$580K/5

$313

$306

-1%

12-Mar

$619K/5

$635K/3

$327

$300

3.40%

12-Feb

$600K/5

$509K/3

$316

$310

-9.40%

12-Jan

$600K/11

$596K/4

$298

$259

-12.80%

West Irvine

n/a

Westpark

12- Sep

12-Aug

12-Jul

12-Jun

12-May

$690K/13

$558K/12

$615K/11

$823K/13

$628K/5

$662K/8

$740K/5

$480K/3

$670K/4

$595K/5

$352

$357

$329

$360

$309

$334

$345

$291

$318

$314

11%

6.2%

-20.3%

-10.4%

14.60%

12-Apr

$624K/14

$651K/8

$360

$304

-10.30%

12-Mar

$565K/17

$615K/10

$319

$331

-2.50%

12-Feb

$649K/21

$506K/6

$319

$361

21.50%

12-Jan

$552K/20

$695K/2

$331

$356

-11.20%

Woodbridge

12- Sep

12-Aug

12-Jul

12-Jun

12-May

$660K/37

$678K/34

$625K/37

$570K/39

$586K/50

$518K/26

$475K/30

$500K/33

$508K/36

$430K/25

$348

$352

$350

$357

$350

$309

$310

$318

$340

$307

3.7%

-3.1%

3.2%

8.6%

-6.40%

12-Apr

$554K/68

$422K/29

$347

$289

-8%

12-Mar

$494K/68

$345K/31

$339

$283

-9.30%

12-Feb

$459K/83

$399K/23

$328

$312

-4.90%

12-Jan

$435K/93

$402K/15

$317

$273

-6.20%

Woodbury

12- Sep

12-Aug

12-Jul

12-Jun

12-May

$915K/18

$732K/27

$845K/25

$823K/30

$872K/24

$535K/11

$480K/9

$452K/9

$470K/15

$650K/11

$353

$326

$353

$359

$363

$328

$305

$295

$316

$310

-1.2%

0%

3.5%

-5.4%

-3.40%

12-Apr

$784K/30

$475K/14

$357

$291

-9.30%

12-Mar

$680K/35

$678K/21

$334

$289

0%

12-Feb

$650K/33

$419K/8

$330

$298

-4.70%

12-Jan

$611K/44

$460K/8

$314

$292

-16.80%

Source: Redfin.com (http://www.redfin.com/home)