Category Archives: News

Irvine House vs Condo Numbers: November 2012

According to Altos Research, Irvine’s single-family housing market is doing slightly better than the previous month. Altos gives Irvine’s single-family homes a Market Action Index of 23.18, which Altos defines as a buyer’s market. (Above 30 is defined as a seller’s market; below is defined as a buyer’s market.) Altos also states that the average single-family home in Irvine has been on the market for about 114 days as of November 9, 2012.
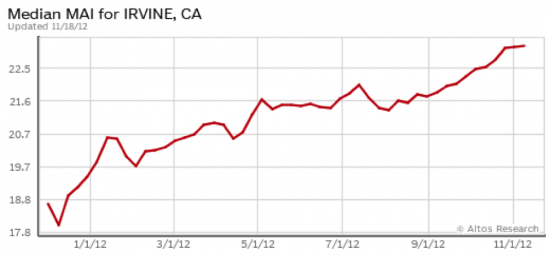
Altos Market Action Index for Single-family Homes in Irvine

Altos Research

Following is Irvine’s October 2012 housing market data provided by Redfin:

Type List Price/# Homes Listed Sold Price/# Homes Sold List Per SF Sold Per SF % Chg Y-O-Y Sold Price/SF
Houses
12-Oct $939K/170 $839K/94 $376 $366 3.70%
12-Sep $958K/205 $690K/91 $375 $346 0.90%
12-Aug $960K/221 $710K/125 $380 $345 -0.30%
12-Jul $949K/226 $760K/95 $382 $368 7.90%
12-Jun $890K/251 $735K/103 $384 $356 5%
Condos
12-Oct $579K/129 $450K/123 $360 $325 10.90%
12-Sep $542K/174 $430K/118 $352 $307 1.70%
12-Aug $525K/168 $427K/141 $338 $306 0%
12-Jul $509K/181 $425K/115 $342 $306 -1.60%
12-Jun $498K/202 $430K/152 $336 $313 -1.30%
All
12-Oct $786K/300 $570K/220 $368 $340 9.70%
12-Sep $750K/381 $530K/210 $365 $323 1.90%
12-Aug $736K/390 $536K/267 $362 $328 3.50%
12-Jul $744K/408 $545K/211 $363 $322 0.30%
12-Jun $720K/456 $515K/257 $363 $327 0.90%

Note:

· The October 2012 overall median selling price was up 19.9% from the previous year.

· The September 2012 overall median selling price was up 6% from the previous year.

· The August 2012 overall median selling price was down 0.6% from the previous year.

The following charts show Irvine’s inventory, median price per square foot of houses, and median price per square foot of condos, respectively.
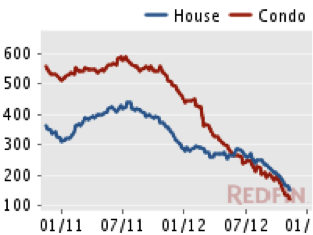
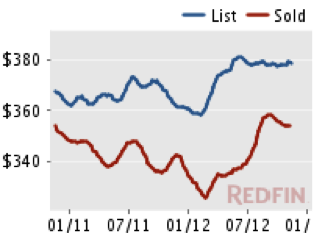
Redfin

If you would like to see the Irvine housing numbers broken down into the neighborhood stats, see my previous post “Irvine Housing by the Numbers – November 2012 Update.”
Irvine Housing by the Numbers – November Update

Here is an updated list of the housing numbers for each of Irvine’s neighborhood. Of note, this month’s median price per square foot for a home in Woodbury is showing a year-over-year increase. Also, University Park homes sold for a higher price per square foot than any other month this year; however, the overall price for University Park homes was not higher than many of the other months of this year.

Area List Price/# Homes Listed Sold Price/# Homes Sold List Per SF Sold Per SF % Chg Y-O-Y Sold Price/SF
Airport/IBC
12-Oct $685K/41 $310K/19 $397 $338 13%
12-Sep $787K/42 $370K/16 $399 $326 2.20%
12-Aug $520K/23 $431K/23 $382 $328 13.50%
12-Jul $594K/27 $468K/18 $406 $312 1%
12-Jun $511K/32 $328K/30 $380 $312 -3.40%
12-May $459K/41 $514K/19 $356 $325 5.90%
12-Apr $442K/48 $340K/25 $350 $304 -5.90%
12-Mar $415K/45 $412K/16 $348 $346 11.60%
12-Feb $392K/48 $330K/15 $337 $288 -11.70%
12-Jan $374K/52 $327K/18 $332 $317 -17%
Columbus Grove n/a
El Camino
12-Oct $549K/15 $438K/12 $393 $314 -1.90%
12-Sep $540K/18 $399K/19 $380 $272 -21.40%
12-Aug $600K/21 $490K/21 $359 $334 -7%
12-Jul $624K/10 $455K/9 $408 $359 16.6%
12-Jun $579K/24 $504K/13 $392 $327 16%
12-May $555K/19 $435K/19 $365 $280 -17.20%
12-Apr $572K/22 $458K/12 $329 $239 -22.10%
12-Mar $546K/22 $468K/10 $329 $327 3.80%
12-Feb $467K/26 $340K/5 $339 $281 -6.60%
12-Jan $462K/28 $389K/6 $322 $267 -28.40%
Northpark
12-Oct $862K/28 $585K/24 $348 $327 8.60%
12-Sep $870K/37 $460K/25 $333 $298 2.10%
12-Aug $809K/48 $488K/40 $333 $289 -2.70%
12-Jul $844K/48 $540K/31 $348 $289 -10%
12-Jun $774K/50 $460K/35 $351 $297 1.40%
12-May $700K/59 $438K/35 $329 $278 -7.3%
12-Apr $649K/51 $390K/29 $339 $283 -10.04
12-Mar $674K/50 $465K/36 $341 $281 -8.80%
12-Feb $459K/74 $415K/13 $301 $280 -9.40%
12-Jan $465K/91 $412K/19 $290 $277 -20.90%
Northwood
12-Oct $823K/34 $640K/27 $341 $325 14%
12-Sep $777K/44 $518K/26 $341 $314 4.70%
12-Aug $735K/51 $612K/38 $322 $317 7.10%
12-Jul $727K/52 $650K/22 $323 $340 9%
12-Jun $692K/62 $525K/27 $316 $295 -8.10%
12-May $697K/52 $584K/32 $314 $267 -13%
12-Apr $599K/59 $579K/30 $312 $310 5.10%
12-Mar $519K/61 $518K/20 $316 $301 -1.60%
12-Feb $504K/66 $292K/13 $300 $287 -7.10%
12-Jan $489K/78 $518K/17 $286 $292 -7.60%
Oak Creek
12-Oct $502K/10 $488K/20 $337 $310 17%
12-Sep $542K/16 $476K/8 $351 $310 -0.60%
12-Aug $644K/16 $433K/16 $328 $327 -3.50%
12-Jul $576K/12 $338K/12 $330 $288 -10.60%
12-Jun $720K/19 $216K/10 $330 $216 -21.10%
12-May $579K/17 $240K/8 $333 $281 -1.7%
12-Apr $530K/19 $628K/14 $303 $315 5.90%
12-Mar $425K/27 $284K/14 $309 $292 -1.40%
12-Feb $487K/26 $267K/13 $317 $267 -15.80%
12-Jan $350K/33 $249K/9 $308 $261 -20.40%
Orange Tree
12-Oct $295K/4 $280K/8 $351 $288 24.10%
12-Sep $280K/6 0 $356 n/a n/a
12-Aug $320K/3 $184K/2 $289 $214 -41.50%
12-Jul $257K/2 $279K/4 $311 $265 -23%
12-Jun $250K/3 $181K/6 $307 $251 -10%
12-May $280K/3 $145K/2 $307 $261 6.1%
12-Apr $278K/6 $165K/1 $256 $203 -31.90%
12-Mar $245K/9 $189K/6 $253 $279 4.10%
12-Feb $242K/6 $200K/6 $249 $230 -33.50%
12-Jan $216K/12 $205K/5 $252 $249 -13.50%
Portola Springs
12-Oct $683K/15 $626K/7 $333 $302 6.30%
12-Sep $639K/22 $621K/13 $319 $322 1.3%s
12-Aug $640K/26 $571K/11 $324 $283 -5.40%
12-Jul $639K/33 $631K/12 $325 $317 1%
12-Jun $622K/31 $724K/8 $321 $308 -4%
12-May $660K/23 $582K/13 $335 $284 -4.10%
12-Apr $693K/30 $596K/11 $330 $299 -11%
12-Mar $639K/25 $950K/5 $325 $320 11.90%
12-Feb $641K/31 $510K/1 $317 $249 -12%
12-Jan $623K/43 $570K/7 $321 $293 1.40%
Quail Hill
12-Oct $594K/14 $862K/6 $373 $390 14.70%
12-Sep $625K/15 $450K/7 $384 $325 -3.80%
12-Aug $630K/15 $600K/12 $392 $392 11.40%
12-Jul $625K/13 $885K/8 $361 $389 21.60%
12-Jun $647K/14 $586K/12 $373 $375 8.1%
12-May $714K/18 $465K/13 $376 $347 -13.00%
12-Apr $749K/17 $863K/6 $373 $374 7.50%
12-Mar $500K/21 $505K/9 $360 $317 -3.10%
12-Feb $515K/21 $470k/6 $364 $307 -10.80%
12-Jan $560K/20 $512K/8 $324 $326 -13.30%
Rancho San Joaquin
12-Oct $407K/2 $388K/5 $320 $308 n/a
12-Sep $485K/3 $495K/2 $346 $336 13.90%
12-Aug $449K/4 $460K/3 $339 $307 -9.70%
12-Jul $509K/3 $433K/2 $320 $269 -6.30%
12-Jun n/a
12-May $475K/5 $410K/2 $313 $306 -2%
12-Apr n/a
12-Mar $465K/5 $500K/2 $246 $296 n/a
12-Feb $492K/6 $360K/1 $297 $336 n/a
12-Jan n/a
Shady Canyon
12-Oct $6,295K/24 $2,600K/2 $742 $636 n/a
12-Sep $6,142K/24 $4,390K/2 $752 $748 19.70%
12-Aug $6,922K/26 $3,124K/4 $770 $561 -3.90%
12-Jul $6,000K/27 $4,555K/3 $760 $586 15.40%
12-Jun $5,998K/26 $3,700K/3 $761 $552 -10%
12-May $6,000K/25 $4,019K/6 $705 $673 30.70%
12-Apr $5,995K/23 $4,875K/4 $720 $512 -6.10%
12-Mar $5,980K/21 $4,436K/4 $720 $657 28.80%
12-Feb $5,995K/23 $3,200K/3 $725 $603 7.50%
12-Jan $5,980K/23 $2,670K/5 $720 $534 24.20%
Turtle Ridge
12-Oct $2,240K/16 $891K/10 $596 $412 -7.40%
12-Sep $1,750K/19 $1,875K/8 $589 $525 9.10%
12-Aug $1,825K/21 $1,950K/9 $567 $504 22%
12-Jul $1,848K/25 $1,440K/12 $571 $510 14.90%
12-Jun $1,875K/27 $1,360K/11 $570 $467 4.70%
12-May $1,749K/31 $1,044K/8 $545 $459 0.10%
12-Apr $1,724K/28 na/8 $533 $421 5.20%
12-Mar $1,899K/28 $1,500K/7 $550 $485 -8.30%
12-Feb $1,899K/27 $955K/4 $527 $441 18.90%
12-Jan $1,672K/32 $532K/4 $493 $355 -25.30%
Turtle Rock
12-Oct $819K/12 $822K/15 $412 $425 6.50%
12-Sep $812K/24 $790K/10 $396 $406 -19%
12-Aug $825K/27 $932K/14 $399 $465 14.80%
12-Jul $837K/32 $975K/10 $421 $451 19.30%
12-Jun $865K/37 $915K/20 $457 $446 3.20%
12-May $939K/37 $730K/9 $454 $410 3.30%
12-Apr $986K/43 $1,050K/5 $457 $461 10.30%
12-Mar $967K/40 $690K/11 $448 $381 17.60%
12-Feb $1,024K/38 $1,422K/4 $457 $559 14.30%
12-Jan $974K/40 $545K/8 $458 $295 -14.20%
University Park
12-Oct $702K/8 $560K/6 $349 $363 18.20%
12-Sep $660K/11 $594K/10 $324 $323 -5%
12-Aug $631K/8 $520K/12 $359 $333 6.10%
12-Jul $699K/7 $560K/5 $331 $312 -9%
12-Jun $599K/12 $540K/10 $345 $333 6.40%
12-May $602K/12 $539K/8 $346 $291 6.20%
12-Apr $609K/11 $538K/7 $352 $272 -15%
12-Mar $552K/14 $431K/6 $288 $305 -5.60%
12-Feb $578K/14 $555K/4 $297 $286 9.60%
12-Jan $595K/14 $420K/7 $289 $281 -10.80%
University Town Center
12-Oct $460K/2 $402K/2 $406 $359 17.30%
12-Sep $489K/2 $365K/5 $393 $344 13.90%
12-Aug $355K/3 $411K/4 $399 $333 9.90%
12-Jul $435K/10 $430K/6 $368 $316 -10%
12-Jun $440K/7 $295K/2 $384 $322 17.10%
12-May $440K/5 $450K/5 $371 $311 6.90%
12-Apr $340K/3 $375K/5 $338 $326 6.90%
12-Mar $455K/7 $478K/4 $298 $321 1.90%
12-Feb $347K/6 $384K/1 $342 $265 -19.50%
12-Jan $467K/10 $480K/1 $330 $315 n/a
Walnut
12-Oct $698K/6 $689K/9 $316 $319 13.10%
12-Sep $582K/8 $597K/6 $340 $298 2.40%
12-Aug $630K/8 $575K/4 $330 $303 -1.30%
12-Jul $626K/14 $528K/1 $330 $321 -4.20%
12-Jun $659K/5 $540K/5 $307 $280 -9.40%
12-May $628K/5 $595K/5 $309 $314 14.6%
12-Apr $532K/3 $580K/5 $313 $306 -1%
12-Mar $619K/5 $635K/3 $327 $300 3.40%
12-Feb $600K/5 $509K/3 $316 $310 -9.40%
12-Jan $600K/11 $596K/4 $298 $259 -12.80%
West Irvine n/a
Westpark
12-Oct $799K/9 $690K/5 $368 $366 5.20%
12-Sep $690K/13 $662K/8 $352 $334 11%
12-Aug $558K/12 $740K/5 $357 $345 6.20%
12-Jul $615K/11 $480K/3 $329 $291 -20.30%
12-Jun $823K/13 $670K/4 $360 $318 -10.40%
12-May $628K/5 $595K/5 $309 $314 14.60%
12-Apr $624K/14 $651K/8 $360 $304 -10.30%
12-Mar $565K/17 $615K/10 $319 $331 -2.50%
12-Feb $649K/21 $506K/6 $319 $361 21.50%
12-Jan $552K/20 $695K/2 $331 $356 -11.20%
Woodbridge
12-Oct $659K/29 $430K/23 $342 $327 13.10%
12-Sep $660K/37 $518K/26 $348 $309 3.70%
12-Aug $678K/34 $475K/30 $352 $310 -3.10%
12-Jul $625K/37 $500K/33 $350 $318 3.20%
12-Jun $570K/39 $508K/36 $357 $340 8.60%
12-May $586K/50 $430K/25 $350 $307 -6.40%
12-Apr $554K/68 $422K/29 $347 $289 -8%
12-Mar $494K/68 $345K/31 $339 $283 -9.30%
12-Feb $459K/83 $399K/23 $328 $312 -4.90%
12-Jan $435K/93 $402K/15 $317 $273 -6.20%
Woodbury
12-Oct $919K/13 $592K/10 $354 $321 7.70%
12-Sep $915K/18 $535K/11 $353 $328 -1.20%
12-Aug $732K/27 $480K/9 $326 $305 0%
12-Jul $845K/25 $452K/9 $353 $295 3.50%
12-Jun $823K/30 $470K/15 $359 $316 -5.40%
12-May $872K/24 $650K/11 $363 $310 -3.40%
12-Apr $784K/30 $475K/14 $357 $291 -9.30%
12-Mar $680K/35 $678K/21 $334 $289 0%
12-Feb $650K/33 $419K/8 $330 $298 -4.70%
12-Jan $611K/44 $460K/8 $314 $292 -16.80%

Source: Redfin.com

Closed Sales from 11/1/2012 to 11/7/2012

Date Sold Address Zip Tract Sold Price Beds Sq Ft
Airport Area
11/6/12 21 Gramercy 415 92612 Belvedere $525,000 1 1594
Columbus Grove
11/7/12 723 Silk Tree 92606 Savannah $400,000 3 1469
El Camino Real
11/5/12 4692 Abbotswood 92604 willows $640,000 3 2160
11/5/12 7 Argent Cir 92604 Ranch $665,000 3 1729
Northpark
11/1/12 12 Bella Rosa 92602 Triana $912,000 3 2850
11/1/12 18 Cabazon 5 92602 Monticello $400,000 2 1400
11/2/12 1603 Terra Bella 92602 Terra Bella $375,000 2 1343
11/2/12 30 El Cajon 32 92602 Monterey $495,000 3 1510
11/2/12 25 Visalia 92602 Brisbane $524,000 3 1802
11/6/12 59 Burlingame 92602 Brisbane $485,000 2 1638
Northwood
11/2/12 40 Monroe #42 92620 Other $330,299 2 1142
11/5/12 3 Trovita 92620 Canyon Creek $858,000 4 2794
11/5/12 260 Monroe 52 92620 Timberline $366,000 2 1142
11/5/12 4 QUEBRADA 92620 Windstream $980,000 5 3275
11/5/12 31 Bunker Hl 92620 Bryanwood $725,000 4 2156
Oak Creek
11/6/12 7 Highfield Gln 92618 Cricket Club $867,500 4 2800
11/7/12 2 Commonwealth 92618 Autumn Glen $1,190,000 4 3400
Orangetree
11/5/12 28 Tangerine 92618 Patio Homes (OT) $400,000 2 1202
Portola Springs
11/1/12 95 Keepsake 92618 Primrose $610,000 4 2056
11/2/12 48 Full Moon 92618 San Carlos COURT $345,000 1 1220
Quail Hill
11/1/12 34 Paperwhite 92603 Soltice $680,000 3 1840
Turtle Rock
11/1/12 10 Monterey 92612 Pointe – Turtle Rock $740,000 3 2104
11/7/12 95 Canyon Creek 92603 Shady Canyon Custom $5,330,000 6 7678
University Park
11/3/12 4922 Basswood Ln 92612 Parkside – Deane $675,000 4 2229
Walnut
11/7/12 14862 Laurelgrove Cir 92604 Colony $365,000 2 976
West Irvine
11/7/12 49 Cliffwood 92602 Ivywood $740,000 4 2106
Westpark
11/4/12 2201 Ladrillo Aisle 70 92606 Brio $292,000 1 785
11/5/12 166 Almador 92614 Las Palmas $520,000 3 1610
Woodbridge
11/1/12 27 Shearwater 92604 Creekside $627,000 3 1538
11/2/12 85 Briarglen 92614 Laurels $365,000 2 1080
11/5/12 27 Waterway 92614 Woodbridge $932,000 3 2669
11/5/12 11 Firestone 92614 Windsor Estates $675,000 4 2255
11/5/12 24 Shooting Star 92604 Creekside $875,000 4 2400
11/5/12 16 Claret 92614 Chateaux $399,000 2 1362

Discuss at Talk Irvine: http://www.talkirvine.com/index.php/topic,3277.0.html

The ABC’s of the Great Park Green Home

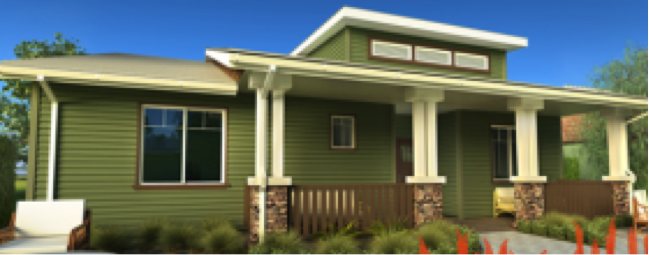
A home that is affordable to entry-level homebuyers, buildable with off-the-shelf materials, and certifiable as green. These are the features of a home that is currently on display in the Orange County Great Park. This display home is a partnership involving Southern California Edison, numerous southern California businesses, and some local schools. The purpose of this home is to show that a green home does not need to be for the high-end buyer only. The name of this display home, which will later be moved and given away to a low-income household or vet, is the ABC Green Home.

A—Affordable to entry-level homebuyers

The goal in building this home is to demonstrate that green longer means drastically more in cost than comparable homes built without green elements. The expectation is that this Great Park ABC Green home can be replicated for about $85 to $125 per square foot, which is currently the cost of building most tract homes in southern California. “Eighty-five dollars to $125 per square foot, that’s extremely affordable,” –Jim Conrady of Western Pavers in San Diego, a contributor to the Great Park ABC Green Home project

B—Buildable using off-the-shelf materials

“Nothing used in the construction is hard to find – everything can be sourced at local builders’ supply yards. From drought-tolerant landscaping and a drip irrigation system; to solar panels; to a state-of-the-art home-energy monitoring system, this home is equipped with everything a family needs for a true Net-Zero living.” –OC Family blog

C—Certified as a “green-home” by obtaining six certificates (including LEED Platinum) from four agencies

This home achieves its “greenest” by going net zero. Net zero means that the home will produce as much energy as it uses. Some of the features of this ABC Green home that help it realize its green and net-zero status are:

• Insulated walls that require less lumber

• Energy efficient heat pumps that heat water and the air and are part of the air conditioning

• 5 ½ kilowatt solar roof panels

• Rainwater collection system

• Gray water recycling system

• Drought tolerant plants

• Touch-controlled kitchen faucets that turn off in four minutes

• An automated system (AMX) to control numerous home features such as the appliances, lights, and security cameras that can be operated from either a wall-mounted panel or remotely by smart phones

In addition, wider doors and lower kitchen counters make this home more accessible to those with wheelchairs.

You can tour this net-zero, one-bedroom, three -bath, Craftsman-style home on Monday, Wednesday, Friday, Saturday and Sunday from 9 a.m. to 4:00 p.m. It is located on Marine Way near the Great Park balloon.

What do you think? Is this something that you would be interested in? And if the cost was slightly higher than a comparable home without the green features, would you consider it worthwhile due to the long-term utility cost savings. And what about the intangible benefits such as the reduced use of resources and a reduced contribution to pollution? Would that be a consideration for you?

Note: This ABC Green Home will be part of the Department of Energy’s upcoming Solar Decathlon at the Orange County Great Park.

Closed Sales from 10/25/2012 to 10/31/2012

Date Sold Address Zip Tract Sold Price Beds Sq Ft
Airport Area
10/31/12 3463 Watermarke Pl 92612 Watermarke $310,000 1 818
Columbus Grove
10/26/12 18 Desert Willow 92606 $863,300 5 3168
El Camino Real
10/25/12 5 Greenwood 92604 Smoketree $389,000 3 1517
Northpark
10/25/12 19 Delano 92602 Bel Aire $935,000 5 3097
10/31/12 15 Riveroaks 92602 Rutherford $859,000 3 2200
Northwood
10/25/12 63 Lindberg 92620 Shady Hollow $788,000 6 2900
10/25/12 9 Garnet 92620 Somerton $1,400,000 5 3700
10/26/12 977 Somerville 92620 Greystone Villas $365,000 2 1260
10/26/12 425 Ridgeway 92620 Greystone Villas $500,100 3 1481
10/26/12 75 Darlington 92620 Greystone Villas $535,000 3 1500
10/27/12 192 Streamwood 92620 Irvine Springs $245,000 2 808
10/29/12 19 Mountainbrook 92620 Fairmont $1,095,000 4 2800
10/29/12 25 Secret Gdn 92620 Camellia $888,000 4 2315
10/30/12 317 Rathbourne 92620 Greystone Villas $399,000 2 1260
10/31/12 77 Grant 92620 Show Case $727,500 4 2536
10/31/12 505 Newcastle 92620 Greystone Villas $510,000 3 1500
Oak Creek
10/29/12 44 Tangelo 92618 * $265,000 2 928
Orangetree
10/29/12 22 Tangerine 92618 Patio Homes (OT) $447,000 2 1202
10/31/12 2304 Apricot Dr 2304 92618 Terrace (Stacked) $346,000 2 1309
Quail Hill
10/25/12 125 Lattice 92603 Olivos $930,000 3 2460
Rancho San Joaquin
10/31/12 17 Rana 48 92612 RSJ Townhomes $465,000 2 1550
Turtle Ridge
10/31/12 51 Valley Ter 92603 Fiore $1,668,000 5 3300
Turtle Rock
10/25/12 16 Bluff Vw 92603 Highlands Lusk $1,955,000 5 4366
10/26/12 75 HIGHLAND Vw 46 92603 Highlands Townhomes $415,000 2 1600
10/29/12 5941 Sierra Bravo Rd 92603 Broadmoor $750,000 3 1802
10/30/12 10 Rainbow Falls 11 92603 Glen Garden Homes $610,000 3 1628
10/31/12 2 El Paseo 92612 Pointe – Turtle Rock $822,000 3 2104
10/31/12 18651 Via Palatino 92603 Hills President $1,398,000 4 3895
10/31/12 19371 Sierra Inez Rd 92603 Broadmoor $929,500 3 1542
Walnut
10/25/12 128 Saint James 92606 Parklane (WN) $420,000 2 1200
10/26/12 30 New Jersey 92606 Revere $694,000 4 2110
West Irvine
10/25/12 29 Olde Berry 55 92602 Andover $425,000 3 1364
Westpark
10/25/12 17 San Garin 92606 Trieste $1,060,000 5 2950
10/25/12 25 La Ronda 92606 Brindisi $500,000 2 1000
10/26/12 21 Decente 92614 Vista West Park $880,000 4 2600
Woodbridge
10/26/12 517 Springbrook 81 92614 Stonegate $410,000 3 1406
10/26/12 3 Goldenrod 92614 Stonegate $410,000 3 1384
10/30/12 23 Autumn Oak 92604 Village Green $355,000 3 1150
Woodbury
10/25/12 76 Canal 92620 Cachette $575,000 3 1640
10/26/12 76 Spanish Lace 92620 Cachette $725,000 3 1959
10/29/12 54 Twin Gables 92620 Montecito $855,000 4 2400
10/30/12 93 Costa Brava 92620 Bowen Court $447,000 3 0

Discuss on Talk Irvine: http://www.talkirvine.com/index.php/topic,3255.0.html