Mortgage delinquencies are on the rise again because of a faltering economy and strategic default from falling prices.


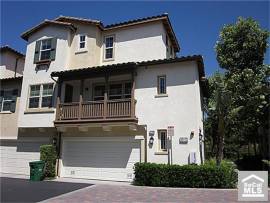
Irvine Home Address … 63 LEMON Grv #279 Irvine, CA 92618
Resale Home Price …… $149,000

That was just you
Now who's telling who
With every step you take
Do you feel yourself falling?
Grasping for that handrail
That's leading you nowhere
Parental guidance gone
Well, it's just another delinquent song
Voodoo Glow Skulls — Delinquent Song
Borrowers who quit paying thier mortgages is nothing new. Historically, delinquency rates on mortgages have hovered between 3.5% and 5.5% in good times and in bad.

What is new and unprecedented is the 11% delinquency rate we saw during the collapse of the housing bubble. For the last two years, this rate has been slowly declining, but it is still elevated well above historic norms.
Personally, I was not surprised to see the delinquency rate go back up as prices resumed their downward spiral. The weak economy was bound to cause an increase in delinquency, and coupled with strategic default from falling prices, higher delinquency rates are to be expected. Apparently, other economists completely missed these obvious signs.
Mortgage payments show surprising rise in delinquencies
By Eileen AJ Connelly, Associated Press — November 9, 2011
NEW YORK – While lawmakers in Washington debated the debt ceiling and consumer confidence dropped, more homeowners were having a harder time making their mortgage payments.
The rate at which mortgage holders were late with their payments by 60 days or more rose in the June-to-September period for the first time since the last three months of 2009, according to TransUnion.
The credit reporting agency said 5.88% of homeowners missed two or more payments, an early sign of possible foreclosure. That was up from 5.82% in the second quarter.
It isn't a big increase, but any increase goes against the downward trend in place for the last two years.
The increase surprised TransUnion researchers, who had expected late payments, or delinquencies, to fall for the quarter.
“It's much different than we've been talking about the last few quarters,” said Tim Martin, group vice president of U.S. Housing in TransUnion's financial services business unit.
In other words, they blew it. They put on the happy-days-are-here-again goggles and saw what they wanted to see. They probably told all their clients things were getting better when in fact they weren't.
The problems were widespread. Between the second and third quarters, all but 10 states and the District of Columbia saw delinquency rates increase.
TransUnion's data is culled from 27 million credit reports, about 10% of U.S. consumers who actively use some form of credit.
Martin could not pinpoint one particular reason for the jump. Normally, for instance, housing prices and unemployment have a big influence on delinquency.
“Those are both still important, but neither has noticeably deteriorated,” he said. In fact, unemployment was steady during the summer and the Standard & Poor's/Case-Shiller index showed small improvements in housing prices in most major cities during July and August.
Prices didn't rise when they should have risen, and this fall and winter, they are plummeting. He missed the obvious.
That leaves wider economic issues having a larger role, Martin said. He pointed to the U.S. credit rating downgrade, the U.S. and European debt crises and the tanking U.S. stock markets during this period. And he noted that two different measures of consumer confidence — the Conference Board and the University of Michigan— both showed those issues hurt consumer attitudes.
That atmosphere “could make folks question paying their mortgage,” he observed, especially if they are under water, that is, they owe more than the house is now worth.
That's nonsense. Does he really think someone, somewhere decided to stop paying their mortgage because the Greeks weren't paying their bills? Give me a break. This is the kind of crap economists come out with when they don't have a clue what they are talking about. It sounds plausible at first, but when you examine it closer, you realize it makes no sense at all.
Martin said there's no real way to tell if some of the delinquency increase was driven by those under water. On the contrary, three of the 10 states that saw declines in late payments were among the hardest hit by the foreclosure crisis: Arizona, California and Nevada.
The decline in delinquency rates in those states is largely because the delinquent got foreclosed on. The rate of foreclosure exceeded the rate of fresh delinquencies. All of those states are non-judicial foreclosure states which weren't impacted by robo-signer delays.
In fact, Arizona had the best rate of improvement in the nation, and now has a delinquency rate of 7.46%. That still places it fourth worst in the country, but the rate is vastly improved from where it stood. In the fourth quarter 2009, Arizona's delinquency rate hit 16%, highest for any state since the foreclosure crisis began.
Arizona does, however, still have the highest foreclosure rate in the nation — one in every 44 housing units with a foreclosure filing in the third quarter, according to Realtytrac.
Another possibility for the bump in the delinquency rate is that a new crop of adjustable mortgages written toward the end of the housing bubble is resetting. Even if their interest rates remain low after the adjustment, payments might have increased, said Darren Blomquist, a Realtytrac spokesman. “We still have the bad loans mixed in that are resetting.”
Remember, it's the recast to a fully amortized payment that causes the real payment shock. Even if interest rates are low, the conversion from interest-only to fully amortized is going to be a problem. The only reason this problem is not worse is because many of these people have already defaulted.

Although TransUnion still expects the delinquency rate to continue to fall in 2012, the company is now forecasting a few quarters of elevated nonpayment rates due to the uncertain economic outlook. The company doesn't predict a return to the national peak rate of 6.9%, but said some increase is expected.
“More and more homeowners are likely to struggle,” Martin said. “I'm not sure this is a one-quarter blip.“
That echoes predictions from other sources, like RealtyTrac.
“This isn't just about bad loans anymore,” said Blomquist. “It's about a bad economy that's pushing people into foreclosure.“

1% appreciation since 1990
$369,000 debt on a $149,000 condo
I didn't know how to headline this property as both stories were interesting.
The condo was purchased at the peak of the 1990s housing bubble, and the bottom of this trough is nearly wiping out all appreciation since then. Buying at the peak of a housing bubble has yielded this property 1% annual appreciation over the last 20 years. The owner would have done better in CDs without all the volatility.
Of course, the owner actually did do better because they managed to borrow $369,000 against the inflated value of this property back in late 2006. Can you believe an 819 SF 1/1 condo appraised for $369,000?
And people say the bubble wasn't obvious to see… bullshit.
——————————————————————————————————————————————-
This property is available for sale via the MLS.
Please contact Shevy Akason, #01836707
949.769.1599
sales@idealhomebrokers.com


Irvine House Address … 63 LEMON Grv #279 Irvine, CA 92618
Resale House Price …… $149,000

Beds: 1
Baths: 1
Sq. Ft.: 819
$182/SF
Property Type: Residential, Condominium
Style: Two Level, Contemporary
Year Built: 1977
Community: Orangetree
County: Orange
MLS#: P801590
Source: CRMLS
Status: Active
On Redfin: 11 days
——————————————————————————
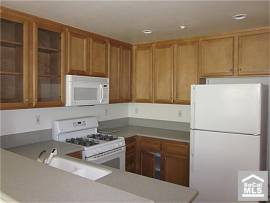
Second level 1 bedroom with a loft floorplan, bright and light condo, spacious living room with vaulted ceiling open to a balcony off the living room tile flooring through out. ONE OF THE LEAST EXPENSIVE CONDOS IN ALL OF IRVINE. Hoa includes pools, spa, tennis courts, gym, clubhouse, water and trash Close to colleage/freeways and toll way for easy commute.
——————————————————————————————————————————————-
Proprietary IHB commentary and analysis ![]()
House Purchase Price … $121,000
House Purchase Date …. 10/4/1991
Net Gain (Loss) ………. $19,060
Percent Change ………. 15.8%
Annual Appreciation … 1.0%
Cost of Home Ownership
————————————————-
$149,000 ………. Asking Price
$5,215 ………. 3.5% Down FHA Financing
4.06% …………… Mortgage Interest Rate
$143,785 ………. 30-Year Mortgage
$50,011 ………. Income Requirement
$691 ………. Monthly Mortgage Payment
$129 ………. Property Tax (@1.04%)
$0 ………. Special Taxes and Levies (Mello Roos)
$31 ………. Homeowners Insurance (@ 0.25%)
$165 ………. Private Mortgage Insurance
$275 ………. Homeowners Association Fees
============================================
$1292 ………. Monthly Cash Outlays
.jpg)
-$62 ………. Tax Savings (% of Interest and Property Tax)
-$205 ………. Equity Hidden in Payment (Amortization)
$7 ………. Lost Income to Down Payment (net of taxes)
$39 ………. Maintenance and Replacement Reserves
============================================
$1,071 ………. Monthly Cost of Ownership
Cash Acquisition Demands
——————————————————————————
$1,490 ………. Furnishing and Move In @1%
$1,490 ………. Closing Costs @1%
$1,438 ………. Interest Points
$5,215 ………. Down Payment
============================================
$9,633 ………. Total Cash Costs
$16,400 ………… Emergency Cash Reserves
============================================
$26,033 ………. Total Savings Needed
——————————————————————————————————————————————————-


.png)


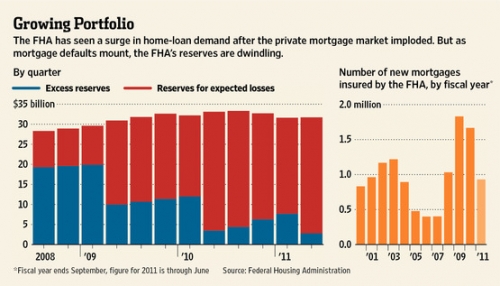

 Despite the fact that the FHA should raise its downpayment requirement and its insurance premium, neither one is going to happen because the effect it would have on the housing market would be too politically unpopular. We are already having difficulty finding wam bodies with jobs to clean up the foreclosure mess. If we make the qualified buyer pool even smaller, the market bottom and ultimate recovery would be even further off into the future.
 They are only expecting to lose $31 billion on its trillion dollar portfolio? Since the vast majority of these loans were underwritten with 3.5% down payments, most of this portfolio is underwater. There is no way they will only lose 3% on a trillion dollar portfolio of underwater loans.


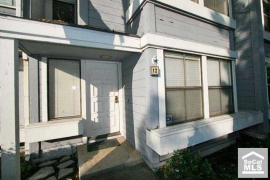
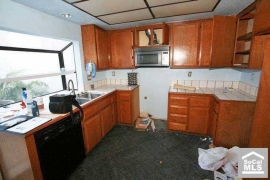
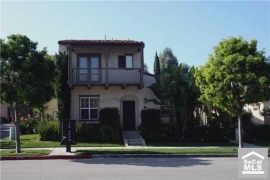
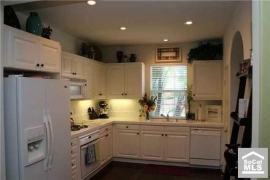
 FANTASTIC END UNIT TOWNHOME NESTLED IN A VERY PRIVATE LOCATION IN THE HIGHLY SOUGHT AFTER WOODBRIDGE PARKVIEW COMMUNITY. THIS WONDERFUL HOME HAS IT ALL. LOVELY FLOOR PLAN WITH 3 BEDROOMS, 2.5 BATH, COZY LIVINGROOM WITH FIREPLACE, CATHEDRAL CEILINGS, PLANTATION SHUTTERS, OPEN KITCHEN WITH DINING AREA AND GOOD SIZE PATIO. CLOSE TO SHOPPING, SCHOOLS, ENTERTAINMENT, FREEWAYS AND MUCH MUCH MORE!!