Category Archives: Library

Apartments are the next real estate bubble

Money seeking returns in real estate is flowing into apartment development. The financial assumptions may not be realistic, and the money flows portend of another real estate bubble.

Irvine Home Address … 38 REMINGTON #31 Irvine, CA 92620

Resale Home Price …… $309,900

It's not as if you didn't get the warning

You got the transcripts and recordings

History has a way of signing us up in the morning

But you're a late starter make it easy to ignore it

Later not recall it – yo

You had unfettered access to the facts

But the fact is your back was turned to the atlas

Nothing like not being in the crash test

To help you make your mind up

2020 — The Herd

There is an old saying in investments: the herd is always wrong. This is only partially true. The herd is wrong about 80% of the time, and for a short time, the movement of the heard makes it right. However, once the herd has taken a position and nobody is left to buy, the herd realizes their mistake and panics to get out causing epic financial disasters.

The latest movement of the herd is into apartment development. As the only asset class related to real estate that makes sense for institutional investors, it stands to reason that some capital flows are warranted. However, in our era of cheap money, more than a little capital is flowing into apartment development.

Cheap money and the flow of capital

The federal reserve is attempting to flood the economy with cheap money. The problem with this approach is that the few good investment alternatives available receive an inordinate amount of capital inflows which causes prices to bubble. This was the consistent criticism of Alan Greenspan, and the same is true of Ben Bernanke. Both of them are bubble boys.

The asset class to receive an over-abundance of capital is apartments. Capital managers have put a small box around class A apartments and said they are acceptable investments. As a result, the capital inflows are keeping apartment cap rates south of 5.5%. Many deals being underwritten today have low cap rates, aggressive assumptions on rent growth, and ridiculous assumptions on the cap rates future buyers will be willing to pay — and capital managers are funding these deals.

This flow of capital is causing apartment development in class A markets — whether they need apartments or not. This supply being added will prevent the rental increases the proformas all rely on. Further, in today's risk adverse environment, 5.5% cap rates sound great, but ten years from now when apartment REITs want to unload these investments at 4% cap rates, buyers will be less risk adverse, and they likely will have better use for the funds than paying a huge premium for a 4% cap rate apartment complex.

The bottom line is apartment deals being underwritten today will not perform as expected. They will not achieve the rent growth, and they will not obtain the resale price at liquidation. It's a bubble. It will likely inflate for another two or three years, then the REITs will watch for the next several years while these investments underperform. Ultimately, they will liquidate for a loss.

So much for being risk adverse.

Analyst: Rents to rise 4.5% for years

June 20th, 2011, 12:00 am — posted by Jon Lansner

The folks at John Burns Real Estate Consulting in Irvine have some bad news for renters: The landlord has pricing power!

“We believe the apartment business is set to explode, with steadily rising rents and occupancy that will justify new construction.”

I also believe the apartment business is set to explode. There will be a boom in construction because dumb money is forcing it to happen. The steadily risiing rents will not materialize at the stellar rates they are hoping for, primarily due to the new supply which will come to the market.

JBREC’s forecast shows rents growing 4.5% annually on average through 2015. The report notes that “Wall Street and pension fund consensus, at least for apartments in good locations in coastal cities, seems to be that 25%-plus rent growth over the next three years can easily occur.”

The pension fund herd is all moving in the same direction. That spells disaster for whatever asset class they are piling into.

Why are landlords in a good spot? Growing household formation and homeownership skittishness. Your landlord’s best new customer will be “young adults, who have either moved back in with their parents or taken on roommates.” Also, weak jobs. “The uncertain environment is enough to convince consumers that renting is safer than taking on a mortgage.”

Weak jobs is a plus for apartments? That is pretty stupid. Rents are directly tied to incomes. Without both job growth and wage growth, rents aren't going anywhere.

Caveats … or why JBREC sees some hope for renters – and homeownership:

Affordability Favors Homeownership: From a mortgage payment to income standpoint, for-sale housing has not been this inexpensive in at least 30 years. We calculate an own vs. rent premium across all metropolitan areas, and in many areas, it is considerably cheaper to own a home than to rent an apartment. …

That is true. However, in our market, it is still cheaper to rent than to own.

Not Smart to Rent Forever: Increasing rents will provide the motivation renters will need to explore owning. As rents start to grow, more renters will consider buying. Most people realize that paying rent all your life is probably not a great retirement decision unless you are a fantastic saver. … Construction Will Increase: Development money is flowing steadily into apartments. One of our favorite land brokers in Tampa, Bruce Erhardt, told us that there are at least eight apartment development sites in escrow right now! … Renters Have a Limit: Several of our apartment clients feel that they are already near the limit of what their tenants can afford. Renters are a clever, creative bunch who won’t take huge rent increases easily.

Rents will start rising from where they are today, but unless incomes go up, rental rate increases will be muted.

Apartments Shine as Beacon of Hope

By Hessam Nadji — August 3, 2011

The nation’s apartment market continues to beat expectations as it speeds along to a full-scale recovery. Vacancy rates peaked in early 2010 at 8 percent and have since dropped to a healthy 5.9%. Effective rental rates have been moving upward for a year-and-a-half now, by 2.5% per year on average, and picking up pace to the 4% to5% range this year. Select markets are registering high single-digit rent growth.

The outlook is quite positive. Tenant demand appears likely to continue to swell, driven by a still-recovering economy, unbundling of households that doubled up during the Great Recession, continued weakness in the for-sale housing market and movement of the relatively large Generation Y (those born between 1983 and 1992) into their peak renter-household-formation years of their 20s and early 30s.

He is overlooking the fact that a weak housing market is direct competition to rentals. As rental rates go up, the rent versus own calculation begins to favor owning, and rental demand will diminish as people chose to buy.

While the number of planned projects is picking up, and the risk of overbuilding by 2013 is increasing in certain pockets, overall construction activity remains very restrained. These factors strongly suggest that vacancy rates will soon fall into the 5% range nationwide, and into the low single-digits in a number of high-beta areas (MSAs, primarily in the Sun Belt and in the West, with above average job growth and net absorption during recovery years) and in a number of supply-constrained areas, primarily coastal MSAs. As it does, rent growth will likely escalate sharply.

This is the kind of delusional nonsense asset managers are listening to. This guy writes a good narrative on why rents should to up, but it is fiction. We will not see above-average job growth for several years, and rents in coastal MSAs will not rise dramatically because they are already astronomically high.

How long will the up market last? Probably through at least 2014 or 2015. It will take at least that long for construction completions to pick up enough to cause vacancy to climb significantly once again. Also, while at some point there likely will be some shift back toward home ownership as consumer confidence in the for-sale market improves, that probably won’t happen to the degree that significantly impacts the apartment market for at least another three to four years. In the meantime, these should be great years for apartment investors.

As i stated earlier, apartment REITs will watch the values of their holdings underperform in the last several years of their ownership. Overbuilding and a renewed enthusiasm for owning will limit demand and prevent large increases in rents.

The investment community already has already anticipated this. The total dollar volume of apartment sales priced at $1 million or greater climbed by an exceptional 77% in 2010 over 2009, albeit from a depressed level in 2009. During the first half of 2011 apartment sales volume reached $25 billion, a 67% jump over the first half of 2010. The average price per unit climbed by 16% in 2010 and by an additional 7% so far in 2011. Median cap rates across the United States have dropped from 7.5% in 2009 to 6.8% as of mid-year 2011, which masks the dramatic drop in cap rates among top-tier assets in primary markets. Prices for large, Class A apartment complexes have come back first, with appreciation starting in late 2009. Class A cap rates in primary markets have re-compressed by 150 bps to 200 bps since the market bottom with many reporting 4% to 4.5% averages, and some below 4%. Given the extraordinary levels of capital looking to enter the sector, the razor-thin cap rate to interest rate spread in upper tiers of the market place, is causing a capital migration to Class B and secondary markets. Value-add, a shunned strategy viewed as too risky just 12 months ago, has reemerged as a viable alternative, even for some institutional investors.

Asset mangers are clueless herd-following sheeple just like residential loan owners. They are overpaying for apartments in anticipation of the greater fool to come along. This is a bubble in the making.

Price support in the future will come from significantly above-inflation rent growth and low vacancies.

LOL! Yeah, right.

In addition, the spread between average, overall cap rates and underlying mortgage rates is near record highs, providing exceptional opportunities for apartment investors.

While many investors are concerned about future funding from the GSEs and their eventual restructuring, the biggest risk to this forecast is the economy.

No, the biggest risk is that asset managers wake up from their delusions and realizes they are a foolish herd being led to slaughter.

This is because other sources of financing are rapidly entering the multifamily market led by life insurance companies and healthy commercial banks. Although the recent boom in rental demand appears to defy weak employment, the tie between apartment absorption and job creation is still significant. Approximately 78% of the jobs added in the last 12 months went to young adults between the ages of 20 years old and 34 years old. While the release of pent up-demand and reversal in home ownership are important drivers, jobs still matter the most.

We have a persistent problem with unemployment. Without great job growth, the dreams of apartment investors will not come to pass.

Even modest job growth should continue to support base line demand for apartments but should the unlikely scenario of an economic contraction materialize, apartment occupancy gains will lose steam, at lease temporarily. The other risk is the lack of economic recovery in the tertiary markets. While the capital migration will bring more capital to secondary markets, and secondary submarket within major metros, true tertiary locations will continue to lag for some time.

Hessam Nadji is managing director, research and advisory services, for Marcus & Millichap Real Estate Investment Services. Contact him at hessam.nadji@marcusmillichap.com.

Stay away from apartment REITs as long-term investments. Perhaps in three to five years, this will be an asset class to short as the bubble becomes obvious.
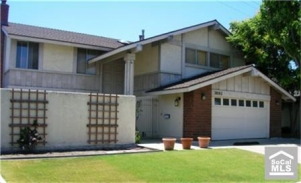
Flip that REO

Flipping is easy when prices are going up 10% or more a year. No matter how incompetent the flipper, time and appreciation will bail them out. In a flat or declining market, flipping is much more difficult.

This property was taken back by the bank at auction on 4/13/2011 for $256,950. It was sold to the flippers for $236,500. The flippers went and borrowed $285,000 from a private investment group who funded the improvements and basically took all the profit from the deal. The flippers have to net more than $285,000 to make any money. If they get their full asking price and pay a 6% commission, they stand to make about $15,000. If they have to come down on the price, they won't make anything.

The previous HELOC abusing Ponzi

The interesting sub-plot to this property is with the woman who owned it previously.

  • This property was purchased as the last bubble was deflating on 1/23/1992. The the original mortgage data is not available, but based on later loans, it is likely this was a 20% down loan. The purchase price was $151,000. The first mortgage was likely $120,800 and the down payment was likely $30,200.
  • On 5/31/2000 (the date I was married), the owner refinanced with a $140,000 first mortgage.
  • On 6/6/2002 she refinanced with a $147,000 first mortgage.
  • On 12/4/2002 she refinanced with a $185,250 first mortgage.
  • On 6/11/2004 she obtained a $125,000 HELOC.
  • On 4/12/2005 she refinanced the first mortgage with a $316,500 Option ARM.
  • After five years on the Option ARM, she likely hit their recast and couldn't afford the payments.

Foreclosure Record

Recording Date: 12/13/2010

Document Type: Notice of Sale

Foreclosure Record

Recording Date: 07/22/2010

Document Type: Notice of Sale

Foreclosure Record

Recording Date: 04/13/2010

Document Type: Notice of Default

Foreclosure Record

Recording Date: 04/13/2010

Document Type: Notice of Rescission

Foreclosure Record

Recording Date: 03/12/2010

Document Type: Notice of Default

This woman was one of thousands of Irvine residents who spent themselves out of house and home.

——————————————————————————————————————————————-

This property is available for sale via the MLS.

Please contact Shevy Akason, #01836707

949.769.1599

sales@idealhomebrokers.com

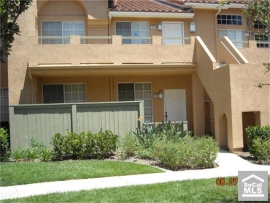
Irvine House Address … 38 REMINGTON #31 Irvine, CA 92620

Resale House Price …… $309,900

Beds: 2

Baths: 2

Sq. Ft.: 1016

$305/SF

Property Type: Residential, Condominium

Style: One Level, Traditional

View: Faces South

Year Built: 1986

Community: Northwood

County: Orange

MLS#: S669573

Source: SoCalMLS

On Redfin: 2 days

——————————————————————————

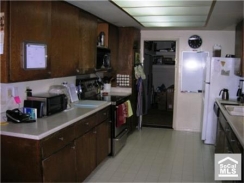
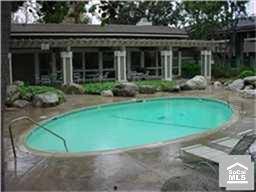
This Remodeled Single Story Lower end unit has 2 Master bedrooms each with their own full bathroom and all on one level. This is off the main road with a large patio for BBQ's or for the kids to play. Also inludes an Inside Laundry area. Granite Kitchen and bathroom counter tops. Seperate Dining area. Walk in Closet with direct patio access from one of the bedrooms. Unit has a Shared 1 car Garage. Garage is number 31. Plenty of additional parking in the complex. Very Clean and a great location in this complex. Standard Sale.

——————————————————————————————————————————————-

Proprietary IHB commentary and analysis

Resale Home Price …… $309,900

House Purchase Price … $236,500

House Purchase Date …. 6/28/2011

Net Gain (Loss) ………. $54,806

Percent Change ………. 23.2%

Annual Appreciation … 173.7%

Cost of Home Ownership

————————————————-

$309,900 ………. Asking Price

$10,847 ………. 3.5% Down FHA Financing

4.19% …………… Mortgage Interest Rate

$299,054 ………. 30-Year Mortgage

$92,428 ………. Income Requirement

$1,461 ………. Monthly Mortgage Payment

$269 ………. Property Tax (@1.04%)

$0 ………. Special Taxes and Levies (Mello Roos)

$65 ………. Homeowners Insurance (@ 0.25%)

$344 ………. Private Mortgage Insurance

$250 ………. Homeowners Association Fees

============================================

$2,388 ………. Monthly Cash Outlays

-$230 ………. Tax Savings (% of Interest and Property Tax)

-$416 ………. Equity Hidden in Payment (Amortization)

$16 ………. Lost Income to Down Payment (net of taxes)

$59 ………. Maintenance and Replacement Reserves

============================================

$1,816 ………. Monthly Cost of Ownership

Cash Acquisition Demands

——————————————————————————

$3,099 ………. Furnishing and Move In @1%

$3,099 ………. Closing Costs @1%

$2,991 ………… Interest Points @1% of Loan

$10,847 ………. Down Payment

============================================

$20,035 ………. Total Cash Costs

$27,800 ………… Emergency Cash Reserves

============================================

$47,835 ………. Total Savings Needed

——————————————————————————————————————————————————-

Irvine condos rent versus own by Global Decision and IHB

Installment #6 in our series of analyses of the Irvine housing market focuses on rents and the cost of ownership of Irvine condos. The surprising result: it's now less expensive to own condos in Irvine on a payment basis relative to rents than before the housing bubble.

Irvine Home Address … 205 SPRINGVIEW Irvine, CA 92620

Resale Home Price …… $130,000

Let me go home

I've had my run

Baby, I'm done

I gotta go home

Let me go home

It will all be all right

Michael Buble — Home

Home is not an address, it is a state of mind. I felt “at home” growing up. I lived in a small community with my parents and extended family. I had roots which ran deep. My family owned their property, subject to a conventional mortgage which they dutifully paid off. The thought of losing the family home never crossed our minds. My parents never did anything to imperil it.

I bought my first home at 29. I bought a lot and contracted its construction. I overbuilt and over-borrowed, and when I had to move to take a job, I had to sell for a loss. I wrote a check at the closing table. Nobody had heard of a short sale in 2000, and I didn't know it was an option. Foolish me.

I am about to close on a home in Las Vegas. The first of many I plan to buy there. My parents are also closing on two homes, and they plan to buy more as well. My family is going “all in” on a bet on Las Vegas's future.

We are buying because the cashflow in Las Vegas is outstanding. We know prices will likely go down for a while, but that just means deals on future homes will get that much better. The window of opportunity will only be open so long, and we want to buy all that we can while the prices are so low. With 8% to 12% cap rates, the positive cashflow will help us ignore the declining resale values for a couple of years. We will have no pressures to sell since we are making money as we hold the property.

Positive cashflow is a significant motivator. The desire to obtain it motivates buyers who will ultimately form the bottom of the housing market. Kool aid intoxication and the belief in the magic appreciation fairy doesn't motivate enough buyers in a declining market to cause a bottom to form. The reason the 2009 rally failed was because prices were still too elevated to make properties cashflow positive.

Two years later prices are lower, and interest rates are lower still. Many properties in many neighborhoods even here in Irvine are trading at or below rental parity. Those are the conditions which prompt people to buy. When enough people are motivated by savings over renting, the owner-occupant herd will move in to stabilize prices. If there aren't enough owner occupants, as there aren't in Las Vegas, then prices fall further until cashflow investors ultimately mop up the mess.

Over the last several weeks, the IHB has been proud to present a series of hedonic house price analyses by Jaysen Gillespie of Global Decision:

An accurate view of the Irvine housing market by Global Decision and IHB

A detailed look at Irvine Village premiums by Global Decision and IHB

The market value of Irvine home features by Global Decision and IHB,

OC Housewife, Ponzi borrower, failed land baron, and

Irvine condo and SFR price trends by Global Decision and IHB

Today's topic is the comparison of the cost of renting versus owning. It's all about cashflow and how it impacts people's decisions.

A presentation by Jaysen Gillespie of Global Decision

info@globaldecision.com

Global Decision is an analytics consulting firm. While our methods are not industry-specific, our engagements are skewed towards specific industries in Southern California, such as real estate (along with online gaming and restaurant chains). We specialize in applying both foundational and advanced analytics to better understand business and economic issues.

Today continues our series on using the Global Decision Hedonic Price Model to determine how homes values are trending and the underlying factors that create such value. For this week’s analysis, we’ve created a hedonic price model for lease rates for Irvine condos. By looking at how the relationship between the cost-to-rent and the cost-to-own, we can derive additional insight into the behavior of the local housing market.

The above chart shows the home value index (2000 Q1 = 100) for Irvine, CA condos, along with an index representing the cost-to-rent for Irvine, CA condos. As our previous post showed, the prices of Irvine condos soared to a bubble peak of approximately 2.5 times the reference prices in Q1 2000. Prices have declined substantially since then, with an average Irvine condo losing about 30% in value over the last 4-5 years.

The Irvine condo home value results are not unique to Irvine and are, in fact, quite representative of the Southern California top-tier housing market as a whole. The thin black line represents the Case-Shiller LAOC High Tier home value index, and it follows a similar price trend.

The blue line, by contrast, is completely different. This line represents the cost to rent, using a hedonic approach to control for the usual factors that influence the rental value (square footage, neighborhood, beds, baths, garage, etc.). The next chart looks at the cost-to-rent line in more detail:

Interestingly, Irvine suffered a mini-bubble in rents, probably driven by falling incomes and rising unemployment. The long-run trend in Irvine rents exhibits a fairly reasonable increase of 2.5%/year (based on the 11-Year CAGR in the rent index). It appears that the Irvine rents are now back “on trend.” A rent bubble is much more likely to deflate quickly: there are no delayed foreclosures, and owners will quickly adjust rental rates to market price to avoid an immediate loss of rental income.

Market rent is not as directly impacted by interest rates. Of course, one might argue that mortgage interest rates affect the demand for owned vs. rental housing, and those shifts in demand may factor into the market rent that a landlord can demand. However, the impact of interest rates is not nearly as significant in the rental market. For this reason, the rental index is a better measure of the true economic value of owning a property.

In one school of thought, the value of any asset is determined by the stream of rental income that asset could produce. This is a very logical way to look at the purchase of a home: by buying a home the real “savings” is the offset to the rent you would have to pay to occupy a similar structure over time. A home is a higher-risk financial proposition in the short term (see our primer on “What Is Risk?” to understand why), and the ownership costs should reflect the risk profile and illiquidity associated with ownership. For this reason, we expect ownership costs to be below rental costs as our “base case.” Deviations from the base case will occur when the market perceives non-financial benefits to ownership and/or when it’s hard to rent a comparable asset. These deviations appear most often in better neighborhoods – and the IHB has cited this phenomenon when quoting how a GRM (gross rent multiple) is often higher in higher-end areas.

The above chart shows the prevailing 30 Year fixed rate mortgage rate for the last 11 years, courtesy of HSH and available for download at http://www.hsh.com/mtghst.html, along with a Global Decision index called the “Own-Monthly-Index.” We’ve estimated the cost-to-own based on both the property purchase price and the prevailing mortgage rate. This estimate is shown as the purple line above. By looking at all four lines, we can develop a four-phase story of the Irvine, CA housing bubble:

Phase 1: 2000-2004. Home prices rose sharply, but new buyers were willing (and able) to finance higher cost properties due to falling interest rates. Monthly ownership costs did not rise appreciably for well-qualified buyers. Loan standards generally allowed “well-qualified” to be defined by (i) DNA at least 98% Homo Sapien and (ii) resting heart rate >= 30 bpm. Ability to fog a mirror considered strong plus.

Phase 2: 2005-2007. Home prices rose sharply, but interest rates remained flat. Buyers incurred much higher monthly carrying costs. The buyer pool was expanded via subprime lending and other non-standard financing arrangements until it reached exhaustion.

Phase 3: 2008-2011. Home prices deflated quickly, falling 30% in 4 years. Rents saw a mini-bubble of their own deflate. 2011 rents remain well below their 2007 peak values.

Phase 4: 2011-Onwards. Interest rates have declined to the point where more-and-more properties have valuations that are supported by monthly costs below rental parity. The tradeoffs between a low monthly ownership cost and the desire to avoid risking capital (down payment), along with the future direction of interest rates (up or down – see Japan 1990-2005) will determine how and where home values find an equilibrium.

The above graph shows the ratio of the property price index to the rent price index, along with the ratio of the monthly payment index to the rent index. The property price ratio to rent remains elevated. However, the payment-lowering impact of 4-5% interest rates has created a situation where the monthly payment index has returned to pre-bubble levels.

Another way to look at the last 11-years of the Irvine housing market is to take two snapshots, each relative to 2000-Q1. The first snapshot is taken at peak-pricing. The bubble “warning signs” were loud and clear (which is easy to say in retrospect!). The cost-to-rent had been growing at 4.9%/year, but purchase prices had been growing at 16.5%/year. For those numbers to pencil, the cost-of-money would have to be declining at a rate that makes up the difference (about 11%/year). Because the cost-of-money decline was only 3.7%/year in that timeframe, the “gap” forms the basis for calling the market a speculative bubble.

In the second snapshot, we find a much more reasonable set of figures. Rents have risen 2.5%/year, and home values have risk at 5.6%/year. However, because the cost-of-money has declined at 4.7%/year, a payment-oriented buyer in 2011-Q1 is no worse off (and potentially better off) in 2011-Q1 than in 2000-Q1. The primary negative to the payment-oriented buyer philosophy is that he or she must carefully consider how the property valuation may change if interest rates are higher in the future.

Conclusions

There are essentially two differing conclusions you could choose to draw from each of the above two charts:

1. The ratio of home sales prices to rents remains elevated and will continue to deflate until pre-bubble levels are restored. The values of homes will continue to decline, unless rents increase significantly. Waiting to purchase a home is a wise decision.

2. The ratio of monthly payments to rents is actually now below 2000-Q1 levels. The impact of low interest rates is now so significant that buyers will be drawn into the market. Buying a low payment will trump worries about declines in the value of the underlying asset. Purchasing a home now is a wise decision.

IrvineRenter's Commentary

The dilemma Jaysen describes above is the core problem with our housing market. There is only one reasonable way to cope with it, and it's the advice we have been giving buyers for the last three years:

Only buy a home if the payment is less than comparable rents and you plan to stay for at least three to five years.

Saving money versus renting is a legitimate reason to buy even in a declining market, but you will have to wait until resale prices rebound before you can sell. That will likely take some time. The further up the housing ladder you look, it's less likely you will find a property selling below rental parity, and it's more likely the property will decline further in value.

Most people given these circumstances will wait — at least the ones who have accurate information about what's happening in the market (that excludes most who believe realtor advice). IMO, this fall and winter will probably be a good time to buy. Next fall and winter will be even better. The fall and winter of 2013/2014… your guess is as good as mine. The window of opportunity is opening. Seize it at your leisure.

What happens when interest rates go up?

The other key point you should take away from Jaysen's analysis is the key role falling interest rates play in affordability calculations. The cost of borrowing money declined by nearly 4% a year for the entire last decade. What happens when the cost of borrowing goes up 4% a year for a decade? It's difficult to imagine that will have a positive impact on pricing.

Prices went up during the 1970s while interest rates rose because wage inflation was high, and lenders allowed debt-to-income ratios to exceed 60% in anticipation of more wage inflation. This was the Ponzi virus Paul Volcker stamped out by raising interest rates to 20%. Do you think it likely that we will see high wage inflation with our current persistent unemployment problem? I don't.

The implication is that prices may be held in check by rising interest rates for a very long time. This may immobilize anyone who buyer today for longer than three to five years. Eventually, amortization on the loan will create enough equity to pay a sales commission to leave, but giving hard-earned money to a realtor is less fun than the magic appreciation fairies bestowing you will hundreds of thousands of dollars. Beware.

A 100% financing holdout

Back in 2007 and 2008, I profiled many properties where the owners put nothing down and walked when prices didn't go up. It's been much more rare to see an owner like the one who owns the loans on today's featured property. He kept making his onerous payments on a property worth about half of what he paid for it. He's a dutiful borrower that undoubtedly pleased the lender. Unfortunately for the lender, he wants out, and he isn't willing to wait the 15 years or more it will take for condo prices to come back.

This property is undeniably cheap to own. Even an FHA buyer will only spend $1,000 a month to live here. At this price, it may even be a decent cashflow investment.

——————————————————————————————————————————————-

This property is available for sale via the MLS.

Please contact Shevy Akason, #01836707

949.769.1599

sales@idealhomebrokers.com

Irvine House Address … 205 SPRINGVIEW Irvine, CA 92620

Resale House Price …… $130,000

Beds: 1

Baths: 1

Sq. Ft.: 475

$274/SF

Property Type: Residential, Condominium

Style: One Level, Other

View: Creek/Stream

Year Built: 1977

Community: Northwood

County: Orange

MLS#: S651639

Source: SoCalMLS

On Redfin: 150 days

——————————————————————————

Short Sale Approved at 130,000 * * * * * Resort Living * * * * * completely remodeled. Great lower level unit in a great neighborhood ! Several tennis courts, two pools, and a balcony with a view of the streams. Large enclosed patio area, easy parking with easy access to front door. In a beautiful complex with lots of trees. Unit is conveniently close to laundry room and main pool. Must see !

——————————————————————————————————————————————-

Proprietary IHB commentary and analysis

Resale Home Price …… $130,000

House Purchase Price … $255,000

House Purchase Date …. 1/9/2006

Net Gain (Loss) ………. ($132,800)

Percent Change ………. -52.1%

Annual Appreciation … -11.5%

Cost of Home Ownership

————————————————-

$130,000 ………. Asking Price

$4,550 ………. 3.5% Down FHA Financing

4.19% …………… Mortgage Interest Rate

$125,450 ………. 30-Year Mortgage

$44,004 ………. Income Requirement

$613 ………. Monthly Mortgage Payment

$113 ………. Property Tax (@1.04%)

$0 ………. Special Taxes and Levies (Mello Roos)

$27 ………. Homeowners Insurance (@ 0.25%)

$144 ………. Private Mortgage Insurance

$240 ………. Homeowners Association Fees

============================================

$1,137 ………. Monthly Cash Outlays

$0 ………. Tax Savings (% of Interest and Property Tax)

-$175 ………. Equity Hidden in Payment (Amortization)

$7 ………. Lost Income to Down Payment (net of taxes)

$36 ………. Maintenance and Replacement Reserves

============================================

$1,005 ………. Monthly Cost of Ownership

Cash Acquisition Demands

——————————————————————————

$1,300 ………. Furnishing and Move In @1%

$1,300 ………. Closing Costs @1%

$1,254 ………… Interest Points @1% of Loan

$4,550 ………. Down Payment

============================================

$8,404 ………. Total Cash Costs

$15,400 ………… Emergency Cash Reserves

============================================

$23,804 ………. Total Savings Needed

——————————————————————————————————————————————————-

NAr: prices down in 72% of markets, first-time homebuyer participation down 24%

The double dip is showing up in the NAr statistics, and the spin and bullshit from the NAr is laughable.

Irvine Home Address … 35 ABRAZO AISLE Irvine, CA 92614

Resale Home Price …… $249,000

Lost in a dream

Nothing is what it seems

Searching my head

For the words that you said

I try to let go, but I know

We'll never end 'til we're dust

We lied to each other again

But I wish I could trust

Megadeth — Trust

One of the key features of many posts on the IHB is the art of critical reading. There is so much garbage in the mainstream media, and corrupt organizations like the National Association of realtors use this cesspool to dispense its bullshit in hopes that someone, somewhere will take it at face value. I read real estate articles every day looking for facts, truth, and insightful analysis. I have only ever found facts, questionable facts, in NAr press releases. Truth and insightful analysis is always lacking.

It's been a couple of weeks since I declared victory over the local realtor association, but the NAr is still practicing the dark art of spinning bullshit into gold. Today we are going to look at their July sales report and see what truth we can salvage from the published debris.

The specifics of data, spin and bullshit

As a reminder:

Data: Factual statements that present statistics or some measurable phenomenon. Presenting data is ostensibly the reason for a real estate press release. However, the real intention is to spin the data or otherwise manipulate the interpretation.

Spin: The offered interpretation of data that forwards the agenda of the organization issuing the press release. Spin is usually a plausible interpretation that is most often taken out of context, knowingly, by the authors.

Bullshit: An interpretation of data that is either not factual, or the data itself is not factual, or an interpretation that is not plausible based on the data. Bullshit is an obvious lie an organization passes off to a gullible public in hopes that nobody catches on.

With that, let's see what the esteemed National Association of realtors had to say about the dismal market conditions in July.

Second Quarter Metro Area Prices Mixed with Little Change, State Sales Down

Washington, DC, August 10, 2011

Median existing-home prices declined modestly in the second quarter with 27 percent of metropolitan areas experiencing price gains from a year ago, while state home sales declined from the second quarter of 2010, according to the latest quarterly report by the National Association of Realtors®.

Notice how the declines are downplayed while the increases are emphasized. What's worse is the emphasized increase masks the extremely negative flipside: 72% of MSAs experienced declines from a year ago. Declining prices and declining sales is a sign that more declines are on the way. If sales had been up, at least an argument could be made that buyers are entering the market to get bargains.

The median existing single-family home price rose in 41 out of 151 metropolitan statistical areas1 (MSAs) in the second quarter from the same period in 2010, including four with double-digit increases; one was unchanged and 109 areas showed price declines. In the first quarter, 34 metro areas had posted gains from a year earlier.

Notice how the sentence above starts with spin to put a good face on the really bad news that follows.

Do you think an NAr spokesman will risk what little credibility they have and use this opportunity to call a bottom?

Lawrence Yun, NAR chief economist, said home prices have been moderating. “Median home prices have been moving up and down in a relatively narrow range in many markets, which shows a stabilization trend,” he said. “Markets showing consistent price stability or increases are those with solid labor market conditions, such as in Washington, D.C.; San Antonio; or Fargo, N.D.”

Falling prices during the one period of the year when prices nearly always rise is certainly not a sign of stabilization. Think of what will happen this fall and winter — a time when prices nearly always fall — after the conforming limit is lowered and the already scarce buyer pool goes into hibernation.

Yun noted the median price measurement reflects the types of homes that are selling during the quarter and can be misleading at times.The level of foreclosures, which can artificially depress median prices, can vary notably in given markets. The annual price gauge smoothes out the quarterly swings and has shown fairly stable price trends in most markets.

Foreclosures don't “artificially depress” anything. Foreclosures are the market. That doesn't mean there are not some markets (like Las Vegas) where prices have been pushed well below their historic levels of support, but that is not “artificial.” It is merely the state of the market right now. Foreclosures are going to impact prices for quite some time.

He added the housing market should be stronger.With home prices in a broad trough and historically low mortgage interest rates, high housing affordability conditions and rising rents could stimulate a more rapid sales recovery if banks get back into the business of lending to more creditworthy borrowers,” Yun said.

Yun was in rare form with that sentence. In some markets, sales and prices should be stronger. Mortgage rates are very low, and affordability is excellent in markets where prices are also low. While it's true that rising rents could stimulate a more rapid sales recovery, this isn't very likely because rents will not rise quickly in a weak economy, and many wouldbe buyers will be forced to rent because the short sale or foreclosure on their record keeps them out of the buyer pool. The bullshit about lowering lending standards is a common meme in realtor circles. It's an easy thing for them to advocate as they take none of the risk but obtain all of the benefit.

NAR’s Housing Affordability Index stood at 176.6 in the second quarter, the third highest on record after the first quarter of 2011 and fourth quarter of 2010. The index measures the relationship between median home price, median family income and mortgage interest rates; the higher the index, the greater household purchasing power. Recordkeeping began in 1970.

I haven't studied the NAr housiing affordability index. I don't have to in order to recognize it is an unreliable gauge because I know the source is not trustworthy. Back during the housing bubble, prices were so high that their affordability measure stated that only about 2% of the population could afford the median sales price. So what did they do? They changed their affordability metrics from measuring against a 30-year amortizing mortgage with a 20% down payment to using an interest-only mortgage with a 10% down payment. Suddenly, prices were affordable again.

The national median existing single-family home price was $171,900 in the second quarter, down 2.8 percent from $176,800 in the second quarter of 2010. The median is where half sold for more and half sold for less. Distressed homes,2 typically sold at a discount of about 20 percent, accounted for 33 percent of second quarter sales, down from 39 percent in the first quarter; they were 32 percent a year earlier.

Did you notice that distressed sales have increased over last years high level? You weren't supposed to. They put in the factoid about 39% of properties were distressed sales in the first quarter to make you think distressed sales are declining when, in fact, they are increasing.

Total state existing-home sales, including single-family and condo, declined 5.4 percent to a seasonally adjusted annual rate3 of 4.86 million in the second quarter from 5.14 million in the first quarter, and were 12.7 percent below a 5.57 million pace during the second quarter of 2010. June 2010 was the closing deadline for the home buyer tax credit.

Half way through the press release, and we finally get to some very revealing information. Sales are down — dramatically. Sales dropped 5.4% from the first quarter to the second quarter. This is typically when both sales volumes and prices are rising. Further, the rate of decline as compared to last year is an astonishing 12.7%. He tries to make excuses by mentioning the tax credit, and that was certainly part of the reason, but the market is very weak right now, and it's more than just the removal of market supports.

NAR President Ron Phipps, broker-president of Phipps Realty in Warwick, R.I., said the key to healthy housing is credit access. “It’s frustrating for many creditworthy potential home buyers to realize that when they’re ready to make a move, banks remain risk averse,” he said.

Yes, I imagine is very frustrating for people who previously could make up income numbers and get 100% financing to be faced with the cold reality of needing good credit, verifiable income, and a down payment. Of course, lenders may find an innovative solution to the problem….

People with good jobs, long-term plans and who are willing to stay well within their means deserve an opportunity to realize their American dream of home ownership. When banks return to normal and safe but sensible lending standards, housing will be able to contribute its traditional share to economic growth.

People with good credit, stable jobs, and a down payment are buying homes. The problem is there are not enough of those people to absorb the supply from the people who couldn't sustain ownership.

It really annoys me when I read these calls from realtors to lower lending standards. Let them put their money at risk if they believe standards are too tight. If they are right, they have an opportunity to make large profits from the low default rates they will experience on the loans they underwrite to all the creditworthy people they believe deserve loans.

Housing has no traditional share of economic growth. Homebuilding does, but we built too many homes in the 00s, and we are currently recycling that inventory through foreclosure. Realtor commissions don't do anything for economic growth other than through the spending power of realtors themselves. realtors add no value to homes, they merely profit from the sale of them. Perhaps they add service value to the buyers and sellers — at least I hope we do — but by and large, realtors drain value from real estate not add to it. If the thousands of realtors who left the profession got trained in something more productive, then we might see some benefit from the housing bubble after all.

Yun clarified the point on economic growth. “The direction of the economy will be determined principally by the housing market recovery, and indications now are pointing toward only a modest recovery,” he said.

Yun couldn't resist the temptation to interject more bullshit into the press release.

The share of all-cash home purchases was 30 percent in the second quarter, up from 25 percent in the second quarter of 2010. Investors, who make up the bulk of cash purchasers, accounted for 19 percent of second quarter transactions, up from 14 percent a year ago.

Increased sales by cash buyers is a sign of a market bottoming. When cash buyers come in, prices have reached market clearing levels. This is the only real good news in the data presented, and the NAr didn't recognize it as such.

First-time buyers purchased 35 percent of homes, down from 46 percent in the second quarter of 2010.

This is an important tidbit they buried deep in the press release. Together with cash buyers and investors, first-time homebuyers are key to the market's recovery. If first-time homebuyers are not absorbing the inventory, prices will continue to decline, and sales will continue to suffer.

Repeat buyers accounted for a 56 percent market share in the second quarter, up from 40 percent a year earlier.

These are probably repeat cash buyers. There isn't much of a move up market, particularly as prices continue to slide.

In the condo sector, metro area condominium and cooperative prices – covering changes in 54 metro areas – showed the national median existing-condo price was $169,200 in the second quarter, which is 3.5 percent below the second quarter of 2010. Fourteen metros showed increases in the median condo price from a year ago and 40 areas had declines.

Notice how the NAr presents the good news first to blunt the impact of the really bad news that follows.

The rest is region specific data generally showing the same pattern of price and sales declines.

Regionally, the median existing single-family home price in the Northeast rose 2.0 percent to $245,600 in the second quarter from a year ago. Existing-home sales in the Northeast declined 4.6 percent in the second quarter to a level of 763,000 and are 19.9 percent below the second quarter of 2010.

The median existing single-family home price in the Midwest fell 5.4 percent to $139,800 in the second quarter from the same period in 2010. Existing-home sales in the Midwest were down 3.1 percent in the second quarter to a pace of 1.05 million and are 18.3 percent below a year ago.

In the South, the median existing single-family home price declined 2.7 percent to $153,000 in the second quarter from a year earlier. Existing-home sales in the South fell 3.4 percent in the second quarter to an annual rate of 1.89 million and are 9.9 percent below the second quarter of 2010.

The median existing single-family home price in the West declined 3.1 percent to $218,000 in the second quarter from the second quarter of 2010. Existing-home sales in the West dropped 10.8 percent in the second quarter to a level of 1.16 million and are 6.2 percent below a year ago.

The National Association of Realtors®, “The Voice for Real Estate,” is America’s largest trade association, representing 1.1 million members involved in all aspects of the residential and commercial real estate industries.

The NAr is the voice for real estate, and they always have the same message, “Its always a good time to buy or sell a house.”

840 square feet that once appraised for $386,500

The owner of today's featured property is a typical Ponzi. He managed to milk this property for $262,350 from his $3,850 down payment back in 1999. I could compute the return on investment, but it would be astronomical. It's owners who had experiences like this guy who keep kool aid intoxication alive. He won the housing lottery, so anyone can, right?

  • This property was purchased for $128,000 on 11/24/1999. The owner used a $124,850 first mortgage and a $3,850 down payment.
  • On 12/26/2000, just over one year later, he got his first mortgage equity withdrawal with a new $136,000 first mortgage. That probably paid off a few Christmas gifts.
  • On 10/18/2004 he refinanced again with a $146,300 first mortgage.
  • On 2/22/2005 he refinanced with a $236,000 first mortgage and obtained a $90,000 HELOC. With those two loans, he nearly doubled his mortgage, but he got $150,000 to play with.
  • On 8/2/2006 he got an Option ARM with a 2% teaser rate for $344,000.
  • On 10/5/2006 WAMU gave him a $42,500 HELOC. This loan was particularly stupid. I can't believe banks gave out seconds on top of Option ARMs. They deserve to lose their money on that one.
  • Total mortgage equity withdrawal is $262,350. We know the guy didn't spend much on the property as the description says it's a fixer. I would be shocked if I hadn't seen a hundred of these before.

What amazes me about properties like this one is that they appraised at such a high value. This is an 840SF 2 bedroom 2 bath condo. It is comparable to an Irvine Company apartment that likely rented for about $1,800 per month back in 2006 when the final loan was approved. Since the final refinance was with an Option ARM, this owner probably had payments near rental parity. Like many others, he believed he would be able to serial refinance into another Option ARM and pull out more HELOC booty when the loan payments were due to increase. In other words, he went Ponzi.

——————————————————————————————————————————————-

This property is available for sale via the MLS.

Please contact Shevy Akason, #01836707

949.769.1599

sales@idealhomebrokers.com

Irvine House Address … 35 ABRAZO AISLE Irvine, CA 92614

Resale House Price …… $249,000

Beds: 2

Baths: 2

Sq. Ft.: 840

$296/SF

Property Type: Residential, Condominium

Style: One Level, Other

Year Built: 1988

Community: Westpark

County: Orange

MLS#: S669465

Source: SoCalMLS

Status: Active

On Redfin: 3 days

——————————————————————————

This floor plan is hardly ever on the market and its a lower unit located near the pool and has an interior tract location it needs a little TLC and is reflected in the price.

——————————————————————————————————————————————-

Proprietary IHB commentary and analysis

Resale Home Price …… $249,000

House Purchase Price … $128,000

House Purchase Date …. 11/24/1999

Net Gain (Loss) ………. $106,060

Percent Change ………. 82.9%

Annual Appreciation … 5.7%

Cost of Home Ownership

————————————————-

$249,000 ………. Asking Price

$8,715 ………. 3.5% Down FHA Financing

4.19% …………… Mortgage Interest Rate

$240,285 ………. 30-Year Mortgage

$77,754 ………. Income Requirement

$1,174 ………. Monthly Mortgage Payment

$216 ………. Property Tax (@1.04%)

$50 ………. Special Taxes and Levies (Mello Roos)

$52 ………. Homeowners Insurance (@ 0.25%)

$276 ………. Private Mortgage Insurance

$241 ………. Homeowners Association Fees

============================================

$2,009 ………. Monthly Cash Outlays

-$185 ………. Tax Savings (% of Interest and Property Tax)

-$335 ………. Equity Hidden in Payment (Amortization)

$13 ………. Lost Income to Down Payment (net of taxes)

$51 ………. Maintenance and Replacement Reserves

============================================

$1,554 ………. Monthly Cost of Ownership

Cash Acquisition Demands

——————————————————————————

$2,490 ………. Furnishing and Move In @1%

$2,490 ………. Closing Costs @1%

$2,403 ………… Interest Points @1% of Loan

$8,715 ………. Down Payment

============================================

$16,098 ………. Total Cash Costs

$23,800 ………… Emergency Cash Reserves

============================================

$39,898 ………. Total Savings Needed

——————————————————————————————————————————————————-

Drift lower or decade of flattening is best-case scenario for housing, Ritholtz

Barry Ritholtz sees a grim future for America's housing market with either a drift lower or a decade of flat pricing.

Irvine Home Address … 3892 CLAREMONT St Irvine, CA 92614

Resale Home Price …… $425,000

I took my love and I took it down

I climbed a mountain and I turned around

And I saw my reflection in the snow covered hills

'Till Landslide brought me down

Stevie Nicks — Landslide

Prices have fallen in a landslide, and owners everywhere find themselves buried under mountains of debt. Some will reflect on their circumstances and realize their own foolish expectations for appreciation prompted them to borrow until the market brought them down. Some will not. Digging out after the landslide will be difficult because the market is not going to elevate people back to an equity position on its own. Borrowers are going to have to dig themselves out by paying down their debts.

Back in March of 2009, I wrote the post, Real Estate's Lost Decade. Many have noted the similarities between our policy responses to the credit bubble and Japan's of the 1990s.

Japan simultaneously inflated massive financial bubbles in real estate and stocks during the late 1980s. The slow deflation of this bubble and the general economic malaise that impacted Japan during the years that followed became known as the “Lost Decade.” The United States is facing a similar set of circumstances in the aftermath of the Great Housing Bubble. So far, we have been following the same policy actions as the Japanese did. Perhaps our officials have come to believe a Lost Decade is preferable to the next Great Depression.

Today, I want to demonstrate how easy it would be to have a similar result in our own housing market. By lowering interest rates to artificially low levels, the Federal Reserve hopes to stabilize the housing market; however, weaning the housing market off these subsidies will need to be a slow process to prevent real estate prices from taking another nosedive. Gradually increasing interest rates back to long-term norms will result in an erosion of buying power that prevents price appreciation. I want to be clear about the implications of this; we are not looking at a decade to get back to peak prices, we are looking at a decade of stagnate prices at the bottom.

I included the following chart as a projection of the future:

The Lost Decade

Realistically, no market ever goes totally flat. Although Irvine is heading down that road right now.

When considering the options facing policy makers, the powers-that-be decided further price drops were preferable to letting prices fall to market-clearing levels. I discussed those options in a February 2009 post titled, Fire and Ice.

First, let's take off the table any ideas of a return of sustained or rapid appreciation before prices return to fundamental valuations. The only people who suggest such ideas are self-serving liars and those who chose to believe them. Anything is possible, but this outcome is so unlikely that I will not waste any print discussing it.

Irvine Fire and Ice Scenarios

Above is a look at the Fire and Ice scenarios for Irvine median home prices. There is a tendency when looking at charts like this one to assume that one scenario is aggressive and the other conservative, so the truth must be in the middle. Don't make that assumption. Prices could easily crash below fundamental valuations as I described in How Bad Could Bad Get. If you think this is not possible, I suggest you check out Christopher Thornberg's predictions (PDF) he just delivered to the BIA of Orange County. He is predicting a 32+% decline from today's prices, that is over 50% off the peak. He is more bearish than I am; he may be right.

Take a look at the grey line in the graph above. That is the fundamental value. It is calculated based on income growth (which has now stopped), 6% interest rates, and a 30-year conventionally-amortized, fixed-rate mortgage with a 20% down payment and a 28% DTI. That is where house prices would be if we would not have had a real estate bubble. The Federal Reserve is working to raise this line by lowering interest rates, but even a drop to 4.5% will not raise it enough to intersect those falling lines at a significantly higher price point. Prices will fall to this line before they find support.

Those predictions were made two and a half years ago. Each of these scenarios is playing out somewhere in America. The Armageddon scenario is happening in Las Vegas.

The Fire scenario is playing out in most of the US.

And the Ice scenario is happening here in Orange County.

I am not the only market observer and analyst to reach these same conclusions.

“Drift Lower” Is BEST-Case Scenario for Housing, Ritholtz Says

By Peter Gorenstein | Daily Ticker – August 12, 2011

“An economy in which you have homeless people and empty homes doesn't make any sense and that's where we're heading,” Nobel laureate Joseph Stiglitz told the Daily Ticker earlier this week.

With home prices continuing to fall in most of the country and sales volume off 13% last quarter compared to prior year, the housing problem, if not getting worse, is certainly still a major mess for America.

True, foreclosure filings dropped 35% last month – to the lowest level in four years – says RealyTrac, but that is in part due to a bottleneck of proceedings caused by the robo-signing induced moratorium.

The data suggests home prices will continue to drift lower for a couple of years – maybe just go sideways for a decade,” says FusionIQ CEO Barry Ritholtz, who predicts another jump in foreclosures unless and until the weak jobs market picks up.

I agree with Barry to a point. Regardless of what happens in the jobs markets, foreclosures are going to pick up again because the shadow inventory is so large. I agree with Barry that if the job market doesn't pick up, we will see another jump in delinquencies which are the precursor to more foreclosures.

In fact, there are so many delinquent homes and underwater homeowners the federal government is looking into renting their share of them in an attempt to stabilize home prices and ravaged neighborhoods. The Federal Housing Finance Agency says it is seeking input from investors on how to rent the 248,000 homes the owned by government-controlled mortgage firms Fannie Mae (FNMA) and Freddie Mac (FMCC) and the Federal Housing Administration.

Ritholtz is not convinced of the programs merits, based on the governments track record as landlords. “The federal government has subsidized and built low income housing and rented it,” he says. “It hasn't been a successful program for them I hate to see them go down that same road.”

Ritholtz has another idea: Attract new homeowners to the country. He suggests the government should reduce the anti-immigrations measures created after the 9/11 attacks and allow more skilled workers to immigrate into the country. “You want to get rid of excessive supply, the way to do it is to create demand,” he says.

The government and the federal reserve has done everything it can to create demand by lowering interest rates, printing money, and exploding the national debt. The only thing they can do further is to follow Paul Krugman's advice and spend, spend, spend until the voters take the checkbook away.

Make it easier for educated people to live the American dream and those homes will be filled, Ritholtz declares. “That to me makes much more sense than getting into the business of being landlords.”

Below is the interview with Barry Ritholtz. Remember the post, Should the GSEs rent REO instead of selling at very low prices? These guys think having the GSEs becoming America's landlord is a very bad idea.

Day after day, I relay the grim truth of the problems in the housing market. I am not anti-ownership as I am buying properties in Las Vegas and helping my family do the same. And I am not a permabear as I am very bullish on buying Las Vegas real estate. Buying and holding real estate can be very emotionally and financially rewarding, but only if the price is right, and only if the motivation is not to capture appreciation and its associated HELOC booty. If I sound like a broken record, its because I don't want to see people repeat the mistakes of the housing bubble.

Prices are not going up any time soon. Don't buy real estate because you think they will be.

$322,000 in MEW without spending a dime on improvements

The owners of today's featured property paid about $256,000 back in 1999 (the actual purchase price is an estimate from tax data and loan data). They used a $248,000 first mortgage and a $$7,000 down payment. They refinanced on 5/14/2002 with a $270,000 first mortgage and withdrew their tiny down payment.

On 10/7/2005, they refinanced with a $570,000 first mortgage. Since they obviously did not spend this money on home improvements, where did the $300,000 go?

They didn't save it to make future loan payments.

Foreclosure Record

Recording Date: 09/07/2010

Document Type: Notice of Sale

Foreclosure Record

Recording Date: 06/04/2010

Document Type: Notice of Default

They have been squatting since early 2010.

This property is in what used to be known as Culverdale, now known as Westpark I. It was built in the early 70s adjacent to the 5 freeway at Culver drive. I profiled a house on this street in September of 2007 in a post aptly titled, You Ugly.

Parts of my description of that house also applies to today's featured property:

This listing is the least desirable single family detached home in Irvine. Everything about this property is a negative:

  • It is 36 years old. (now 40 years old)
  • There is no back yard. …
  • The house itself is right on the 405 on ramp at Culver. A location guaranteed to have maximize noise and air pollution as people accelerate onto the freeway.
  • If that wasn't bad enough, it is adjacent to a huge power pole with enough electricity running through it to make your hair stand on end and give your children brain cancer. Perhaps the hum of the power lines drowns out the freeway noise. Who knows?

I would not live in this house.

At $179/SF, someone will perceive this to be a bargain and buy the property. With all its negatives, there is still a price where someone will deal with its issues in order to live in Irvine. Perhaps $425,000 is the right number? Even an FHA buyer could live here for about $2,200 per month. Someone will probably buy it as a rental. It may even be cashflow positive, a rarity in Irvine. Personally, I will pass.

——————————————————————————————————————————————-

This property is available for sale via the MLS.

Please contact Shevy Akason, #01836707

949.769.1599

sales@idealhomebrokers.com

Irvine House Address … 3892 CLAREMONT St Irvine, CA 92614

Resale House Price …… $425,000

Beds: 5

Baths: 2

Sq. Ft.: 2376

$179/SF

Property Type: Residential, Single Family

Style: Two Level, Contemporary

View: Faces North, Faces South

Year Built: 1971

Community: Westpark

County: Orange

MLS#: P792026

Source: SoCalMLS

On Redfin: 3 days

—————————————————————————–

WESTPARK — PRICED WAY BELOW MARKET BECAUSE BUYER WILL HAVE SIGNIFICANT DEFERRED MAINTENANCE TO REPAIR. .. .MAJOR FIXER SOLD 'AS-IS' — SHORT SALE. Large home with FIVE bedrooms and 'great bones' with potential! Front courtyard/patio entry. Formal living room w/ beautiful stairway needs finish detail; formal dining room converted to large storage/walk-in pantry. Informal eating area off kitchen to Den/Family Room. Inside laundry room. Garage with work areas. Enclosed patio/workshop — can be converted back. Rear yard w/ raised garden planters. Large master bedroom & dressing area & small walk-in closet. Three other bedrooms + another LARGE bedroom suite upstairs. Attic space w/ pull-down stairs. Diamond in the rough! Home needs lots of TLC and a buyer with vision! INVESTOR's FLIP opportunity. EXCELLENT SCHOOLS. .. walk the kids!

——————————————————————————————————————————————-

Proprietary IHB commentary and analysis

The realtor is so desperate they are even appealing to flippers. Funny.

Resale Home Price …… $425,000

House Purchase Price … $255,670

House Purchase Date …. 4/27/1999

Net Gain (Loss) ………. $143,830

Percent Change ………. 56.3%

Annual Appreciation … 4.1%

Cost of Home Ownership

————————————————-

$425,000 ………. Asking Price

$14,875 ………. 3.5% Down FHA Financing

4.19% …………… Mortgage Interest Rate

$410,125 ………. 30-Year Mortgage

$116,389 ………. Income Requirement

$2,003 ………. Monthly Mortgage Payment

$368 ………. Property Tax (@1.04%)

$0 ………. Special Taxes and Levies (Mello Roos)

$89 ………. Homeowners Insurance (@ 0.25%)

$472 ………. Private Mortgage Insurance

$75 ………. Homeowners Association Fees

============================================

$3,007 ………. Monthly Cash Outlays

-$315 ………. Tax Savings (% of Interest and Property Tax)

-$571 ………. Equity Hidden in Payment (Amortization)

$22 ………. Lost Income to Down Payment (net of taxes)

$73 ………. Maintenance and Replacement Reserves

============================================

$2,216 ………. Monthly Cost of Ownership

Cash Acquisition Demands

——————————————————————————

$4,250 ………. Furnishing and Move In @1%

$4,250 ………. Closing Costs @1%

$4,101 ………… Interest Points @1% of Loan

$14,875 ………. Down Payment

============================================

$27,476 ………. Total Cash Costs

$33,900 ………… Emergency Cash Reserves

============================================

$61,376 ………. Total Savings Needed

——————————————————————————————————————————————————-

Principal reduction program where debtors take an equity-share position

Ocwen has come up with a new program to forgive principal in exchange for an equity participation interest in future appreciation.

Irvine Home Address … 38 CARTIER AISLE Irvine, CA 92620

Resale Home Price …… $449,000

Take a piece of my life

Take a piece of my soul

Take a piece of my face

So I can never grow old

And take a piece of my world

Take a piece of my heart

Take a piece of my brain

So I can never be smart

The Pretty Reckless — Everybody Wants Something from Me

Borrowers facing foreclosure feel like their lender wants a piece of them. Either they must keep making onerous payments, or they must give up their family homes. Neither option is palatable, but lenders will not provide better options because it will foster moral hazard and irresponsible borrowing in the future.

In the post Foreclosure is a superior form of principal reduction, I noted the following:

Excessive debt is the problem

Ever since the Great Housing Bubble began to deflate, everyone has incorrectly identified the problem as foreclosure. The real problem is not foreclosure, the real problem is that borrowers have excessive debts due to the huge loans lenders underwrote that inflated the housing bubble. Foreclosure is not the problem, it is the cure. Further, there is only one reason foreclosure is seen as the problem: people have to move out of their homes after a foreclosure, and I have demonstrated how private hedge funds and other parties could solve that problem.

One way or another, the banks are going to write down huge amounts of bad debt. Nothing can save them, and we shouldn't try. Principal reductions are the worst possible solution to the problem of excess debt left over from the Great Housing Bubble. Principal reductions merely gives foolish borrowers a pass. If the borrowers go through foreclosure, they have consequences that minimize moral hazard:

  1. Borrowers will be forced to rent, at least for a time.
  2. Borrowers will have reduced access to consumer credit as the foreclosure lowers their FICO score.
  3. Borrowers will have to save and be prudent in order to meet the standards of home ownership and get another loan.

All of those consequences — inadequate though they may be — are eliminated if the GSEs merely reduce principal. The borrowers who have the most to gain are those who borrowed most foolishly, and the people paying the price are (1) prudent borrowers and (2) those who didn't borrow at all. Next time around, there will be no prudent borrowers, and everyone will participate. Who is going to pass on free money?

Any program which touts principal reduction has the built-in problem of moral hazard. The less people are punished for their foolish decisions, the more likely they are to repeat them. Further, others witnessing the rewards of the foolish will emulate them in the future. The program discussed today attempts to remedy this problem. I'll let you decide if you believe they are successful.

Ocwen unveils new principal reduction program

by JON PRIOR — Tuesday, July 26th, 2011, 11:37 am

Ocwen Financial Corp. launched a new modification program to reduce the principal on a mortgage for delinquent borrowers, while compelling them to share in the future appreciation of the home's value with the investor.

When lenders are faced with enormous losses on commercial loans, one alternative they generally consider in lieu of foreclosure is to take an equity-participation position. This provides them the recovery benefit of future appreciation without having to foreclose and take title.

Commercial lenders do this because they don't have the management expertise to run a commercial center, and it is easier to keep a motivated owner in place who will work to make the project successful while it is underwater.

Residential loans are different because it doesn't take any special expertise to own a house, but lenders are considering the same solution because it will allow them to defer recognizing losses, and if they can get the borrower to resume making payments, even at a reduced amount, it may be better than forcing a foreclosure auction and writing down the debt.

Mortgage modifications will only be available for homeowners in negative equity.

No owner with equity would want to give up their future appreciation. Loan owners with high payments but sufficient equity to escape are more likely to sell and move on.

Atlanta-based Ocwen holds a $74 billion servicing portfolio after acquiring Litton Loan Servicing and HomEq. Ocwen launched the Shared Appreciation Modification program as a pilot in August 2010, a program the company believes will make a major dent in the roughly 14 million mortgages currently in negative equity, according to Moody's Analytics.

Another cure-all for the housing market? This program will not make a significant dent in any problem, but it does provide a better alternative for borrowers who want to stay in their homes than current loan modification programs that are merely Option ARMs in disguise.

Through the program, Ocwen will write down qualified loans to 95% of the underlying property's market value. The amount written down is forgiven in one-third increments over three years as long as the homeowner remains current. When the house is later sold or refinanced, the borrower will be required to share 25% of the appreciated value with the investor.

This is really a fair deal for deeply underwater borrowers who would prefer not to leave their homes. Of course, the details matter, and if the loan owner is still making onerous payments, then they still have significant incentive to default. Do the payments drop each year as the loan balance is forgiven?

“Like all modifications, SAMs help homeowners avoid foreclosure. But they also restore equity. That's a significant benefit to the customer and, we believe, the economy and housing market. Psychologically, it's important too,” said Ocwen CEO Ronald Faris. “Our analytics tell us that an underwater mortgage is one-and-a-half to two-times more likely to default than one with at least some positive equity.”

Negative equity is an oxymoron lenders use to give psychological comfort to borrowers who have nothing. Positive equity is a redundant term that should also be eliminated from proper speech.

Owners with equity generally won't strategically default. Although, i strongly suspect such owners will be more likely to sell immediately once they do have equity because the incentives now favor selling out.

Once the owner is back above water, they can remain in their home and give up 25% of future appreciation, or they can sell their home, buy a comparable property, then keep all future appreciation. What would you do?

I think this will help lenders slowly take their write downs while keeping borrowers paying on underwater properties for three years. In that respect, it helps the bank on both fronts. If these equity participation positions are being sold to investors, I doubt these investors will see much return as most borrowers will sell to get out from under this obligation.

SAM is one of the first principal reduction programs initiated by a private company without the prodding of a government agency. Other servicers have sporadically used Hardest Hit Fund and Home Affordable Modification Program dollars to write down principal, but only in select states.

Since August, Ocwen said 79% of the borrowers accepted the offer with a redefault rate of 2.6%. Ocwen said it has regulatory clearance to push the program into 33 states.

If you give desperate underwater homeowners a lifeline, they will take it. They tout a 2.6% redefault rate over the last year as being low — and it is much lower than redefault rates on most loan modifications — but a 2.6% default rates even after principal is reduced is still quite high.

J.T. Smith, the chief investment officer for the boutique investment bank Aristar Funding Group said there are many still unknown parts of how Ocwen will structure the modifications such as tax liens and future title issues, but granting the borrower 75% of the appreciation is “very generous.”

Probably too generous. It will be difficult to find investor who want to pay much money for a small portion of appreciation particularly given the high likelihood of early redemption.

“This program is a win for the borrower and very, very generous of Ocwen and investors,” Smith said. “Silent seconds are a more equitable solution, so Ocwen borrowers should take these modifications and run with it.”

This program will also serve to cut off future HELOC borrowing. The equity share position will undoubtedly be calculated as the difference between the first mortgage and the resale value exclusive of any future encumbrances. It will be very difficult for borrowers to obtain HELOCs as the new lender will be in a third mortgage position subordinate to the equity-share's claim.

Consumer organizations supported the program as well. Marcia Griffin, president of HomeFree-USA, a community-based homeownership development group, called the program “visionary.”

“The homeowner benefits from a stable housing situation and the investor is positioned to share in the future appreciation of the home's value. In addition, communities nationwide will benefit from fewer foreclosures,” Griffin said.

John Taylor, CEO of the National Community Reinvestment Coalition, said other servicers should follow suit.

This still leaves the question of who pays for this. There is no way the investors are covering the cost of the write down in order to obtain a hoped-for 25% of the recovery. At best, investors in a scheme like that might offer 5% of the amount written off. The lender must still absorb a huge write down to make this program work. The real benefit for lenders is a controlled and measured rate of write down they can budget for.

“This innovative modification program offers meaningful help for underwater borrowers. The simplicity and rationale of the SAM is striking: the homeowner maintains the equity that would otherwise be lost in the foreclosure process, and servicers and investors maintain a performing asset,” Taylor said.

A spokesman for Ocwen did not immediately disclose how many borrowers the program is expected to reach.

Write to Jon Prior.

Follow him on Twitter @JonAPrior.

All principal reduction programs contain moral hazard because foolish borrowers are not facing the consequences of their mistakes. Foreclosure is the best form of principal reduction. However, this program does provide some consequences, watered down through they may be. It's a reasonable compromise in a situation with no easy answers.

More HELOC abuse and squatting

The owners of today's featured property borrowed beyond their means, and they have been rewarded with two years of free money and two years of free housing.

  • This property was purchased on 7/21/2003 for $427,000. The owners used a $322,700 first mortgage, a $61,600 second mortgage, and a $42,700 down payment.
  • On 8/27/2004 they obtained a $187,000 HELOC.
  • On 5/16/2005 they obtained another $187,000 HELOC.
  • On 3/30/2007 they refinanced with a $500,000 first mortgage.
  • Total mortgage equity withdrawal is $115,700.
  • Total squatting is at least 28 months.

Foreclosure Record

Recording Date: 02/18/2011

Document Type: Notice of Sale

Foreclosure Record

Recording Date: 09/17/2010

Document Type: Notice of Sale

Foreclosure Record

Recording Date: 10/07/2009

Document Type: Notice of Sale

Foreclosure Record

Recording Date: 07/02/2009

Document Type: Notice of Default

——————————————————————————————————————————————-

This property is available for sale via the MLS.

Please contact Shevy Akason, #01836707

949.769.1599

sales@idealhomebrokers.com

Irvine House Address … 38 CARTIER AISLE Irvine, CA 92620

Resale House Price …… $449,000

Beds: 3

Baths: 3

Sq. Ft.: 1764

$255/SF

Property Type: Residential, Condominium

Style: Two Level

Year Built: 1989

Community: Northwood

County: Orange

MLS#: P791767

Source: SoCalMLS

Status: Active

On Redfin: 1 day

——————————————————————————

Largest Model W/ Main Floor Bedroom/Full Bath, Private Tropical Gated Front Courtyard Entry, Open & Spacious Floorplan W/ high Vaulted Ceiling & Lots of Windows, Huge Master Suite W/ High Volum Ceiling, spacious Kitchen w/ Lots of Cabinets, Seperate Breakfast Nook Area, Wood Flooring Downstairs, Private Location, Very Low HOA, No Mello Roos, Close to Everythings.

——————————————————————————————————————————————-

Proprietary IHB commentary and analysis

Close to Everythings? High Volum Ceiling? Seperate?

Resale Home Price …… $449,000

House Purchase Price … $427,000

House Purchase Date …. 8/7/2002

Net Gain (Loss) ………. ($4,940)

Percent Change ………. -1.2%

Annual Appreciation … 0.6%

Cost of Home Ownership

————————————————-

$449,000 ………. Asking Price

$15,715 ………. 3.5% Down FHA Financing

4.31% …………… Mortgage Interest Rate

$433,285 ………. 30-Year Mortgage

$126,492 ………. Income Requirement

$2,147 ………. Monthly Mortgage Payment

$389 ………. Property Tax (@1.04%)

$0 ………. Special Taxes and Levies (Mello Roos)

$94 ………. Homeowners Insurance (@ 0.25%)

$498 ………. Private Mortgage Insurance

$140 ………. Homeowners Association Fees

============================================

$3,268 ………. Monthly Cash Outlays

-$340 ………. Tax Savings (% of Interest and Property Tax)

-$591 ………. Equity Hidden in Payment (Amortization)

$25 ………. Lost Income to Down Payment (net of taxes)

$76 ………. Maintenance and Replacement Reserves

============================================

$2,437 ………. Monthly Cost of Ownership

Cash Acquisition Demands

——————————————————————————

$4,490 ………. Furnishing and Move In @1%

$4,490 ………. Closing Costs @1%

$4,333 ………… Interest Points @1% of Loan

$15,715 ………. Down Payment

============================================

$29,028 ………. Total Cash Costs

$37,300 ………… Emergency Cash Reserves

============================================

$66,328 ………. Total Savings Needed

——————————————————————————————————————————————————-