Author Archives: zovall

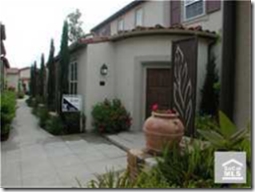
Chantory – Another Turtle Ridge Flip

Address: 77 Canyoncrest, Irvine, CA 92603 (Turtle Ridge)

Plan: 1275 sq ft – 3/2.5

MLS: S460156 DOM: 47

Sale History: 5/27/2005: $759,000

Current Price: $829,000

Here we’ve got a Plan 3 detached condo in the Chantory tract built by California Pacific Homes in Turtle Ridge. It was purchased about a year and a half ago with 10% down. Assuming 6% selling costs, the sellers stand to make a $20k profit!

In this case, is the potential reward of $20k worth the risk? Don’t housing prices always go up? Who cares if you only plan on living in the house for a year or two. Don’t rent, just buy!

Anyways, let’s see what other Plan 3’s are currently available:

  • 137 Canyoncrest – $769,000 (originally $795,000) – 95 DOM
  • 82 Clouds View – $798,000 – 51 DOM

Horizons – Upside Down in Northwood

Address: 11 Remington, Irvine, CA 92620 (Northwood)

Plan: 1016 sq ft – 2/2.5

MLS: S459567 DOM: 49

Sale History: 1/31/2006: $440,000

4/22/1999: $160,000

Price Reduced: 10/04/06 — $445,000 to $434,900

Price Reduced: 10/10/06 — $434,900 to $424,900

Current Price: $424,900

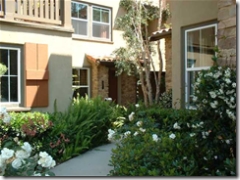
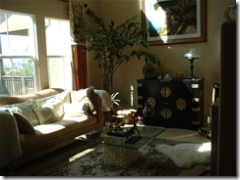
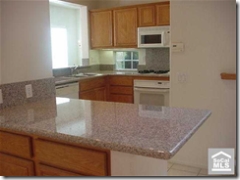
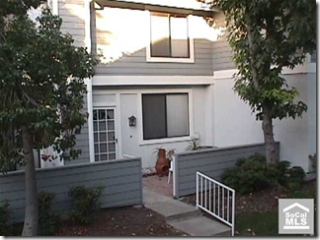
This Plan E in the Horizons tract in Northwood was purchased at the end of January 2006 and placed back on the market about 8 months later. The flipper bought it with 100% financing and originally listed it just a tad higher than their purchase price. The reductions came pretty quick initially and now the this seller will definitely be under water. Check out the pictures! Unfortunately, it doesn’t look too appealing (at least to me). That will make it just that much harder to unload.

Since our flipper purchased this home with 100% financing, they will have to come up with a nice sum of money (over $40k assuming 6% selling costs) to get out of this property. Or maybe the lender will have to take the hit on this one.

Big drop in Ashton Green in Turtle Ridge

Address: 108 Coral Rose, Irvine, CA 92603 (Turtle Ridge)

Plan: 1398 sq ft – 2/2.5

MLS: S445098 DOM: 150

Sale History: 3/31/2005: $619,990 ??

Price Reduced: 08/23/06 — $750,000 to $725,000

Price Reduced: 10/06/06 — $725,000 to $689,000

Price Reduced: 10/13/06 — $689,000 to $669,000

Price Reduced: 11/03/06 — $669,000 to $595,000

Current Price: $595,000

MLS Description: CONDO GIVEAWAY! THAT’S RIGHT $595,000. GORGEOUS MODEL HOME BY SHEA BUILDERS. 2 BD, 2.5 BA. ALL THE GOODIES AND HAS A VIEW. WAS PRICED AT $750,000, AT $669,000—-AND NOW YOU NAME THE PRICE!

This is a Plan 7 in the Ashton Green tract in the village of Turtle Ridge. So what’s going on here? Your guess is as good as mine! Let me tell you what I’ve found so far:

  • No prior sales history in Zillow or the Title database
  • The last plan 7 (actually a 7A which had 1426 sq ft) sold for $815,000 on 5/24/2006 – an all time high for this tract
  • Property taxes are listed as UNPAID
  • Title lists the owner as “SHEA HOMES LTD PARTNERSHIP” and thus no loan information

I actually found an old listing in MLS (P422498) that shows the property listed by Shea Homes and sold to a buyer for $619,990 on 3/31/2005. The agent representing the buyer in that transaction is the same agent that is listing the property now. **IF** we assume the MLS info for the purchase is correct, then this flipper will lose $60,690 (assuming 6% in selling costs) if they sell at $595,000! They are selling for LESS than what they bought the property for FROM THE BUILDER!

Could Shea possibly still own this home or is the title information just not accurate? Is the seller in default? Why are the prior year’s taxes still unpaid? Is the ‘low’ price an attempt to generate offers after probably receiving none for the last 5 months?

Trovata – Another Westpark Casualty – UPDATE #1

Address: 20 Avanzare, Irvine, CA 92606 (Westpark)
Plan: 1876 sq ft – 4/2.5
MLS: S452340 DOM: 80
Sale History: 6/03/2005: $753,000
7/30/1999: $343,000
10/30/1996: $228,000
Price Reduced: 08/26/06 — $795,000 to $775,000
Price Reduced: 10/05/06 — $775,000 to $759,900
Current Price: $759,000

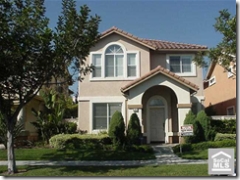
This Plan 3 in the Trovata tract built by K Hovnanian was purchased with 10% down last summer for $753k. The price has been reduced a couple times and now the asking price is almost the same as the purchase price from over a year ago. It looks like a nice, clean, well kept home and 4 bedrooms at this price sounds pretty competitive. Any Westpark residents care to chime in? After 6% in selling costs, this seller will lose over $40,000 when all is said and done. That doesn’t even take into account the carrying costs of this vacant home which could be pretty substantial depending upon how long it’s been empty.

A quick look in the neighborhood reveals an identical Plan 3 for sale at 731 Paseo Westpark:
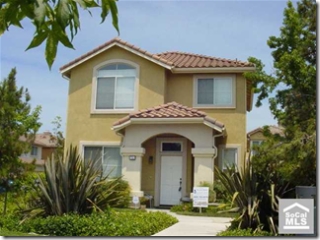
Address: 731 Paseo Westpark, Irvine, CA 92606 (Westpark)
Plan: 1876 sq ft – 4/2.5
MLS: P525054 DOM: 101
Sale History: 10/01/2001: $415,000
Price Reduced: 08/15/06 — $825,000 to $789,000
Price Reduced: 09/02/06 — $789,000 to $770,000
Price Reduced: 09/26/06 — $770,000 to $759,000
Current Price: $759,000

The private remarks for 731 Paseo Westpark say ‘VERY MOTIVATED SELLERS. MAKE AN OFFER!’. It’ll be interesting to see how this plays out with both plan 3’s priced exactly the same.

UPDATE #1 – November 4, 2006

Our non flipper at 731 Paseo Westpark made the first move by lowering their price on November 1 to $742,500. Now we wait and see if our flipper at 20 Avanzare chases the market down.
More Irvine Sales Trends – Home Grown

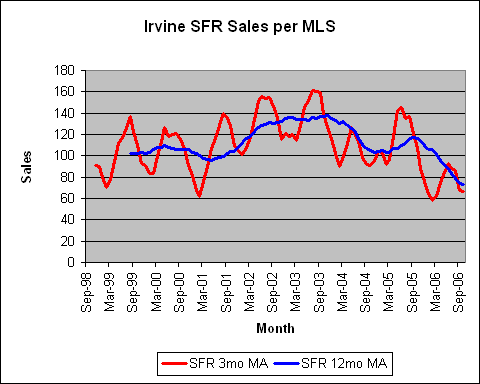
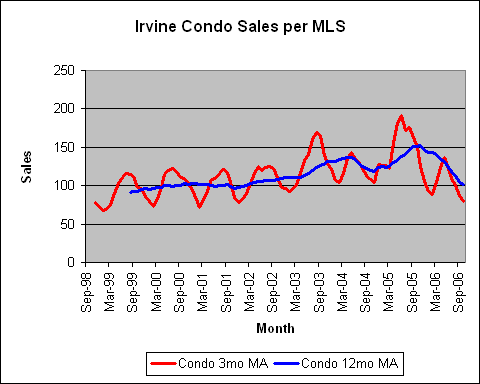
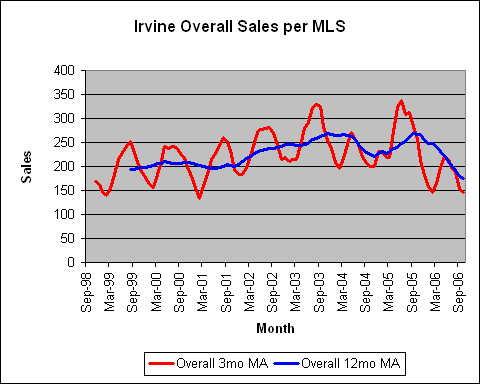
Anyone here have a Data Quick subscription that you wouldn’t mind sharing with me? 🙂 Until then, I’ll have to rely on what I can find from MLS. I’ve gone through and performed counts of the number of closed sales in Irvine (SFR, condo, and total) for each month since September 1998.

A few notes about the data. The data is from the MLS Alliance database which aggregates listings from the 8 various MLS systems in Southern California. Because of the multiple MLS systems (go figure!), sometimes properties are entered in more than one MLS system and it appears twice in MLS Alliance. But this doesn’t happen too often with listings in Irvine. Also, for the most part, these numbers do not contain new home sales since builders in Irvine do not usually put their homes into MLS.

Yes, I know these charts are fugly as hell. Does anyone have any tips on making better charts?

I’ve also made the raw data available in case anyone is interested:Irvine Sales Trends.xls

I went ahead and used moving averages to smooth out the monthly changes. The actual monthly data is in the XLS file.