Author Archives: IrvineRenter

NAr: sales decline in 78% of markets and prices fall 4.5% nationwide

The spring selling season is sporting sales declines in 78% of MSAs surveyed, and the prices nationally have fallen 4.5% in the last year.
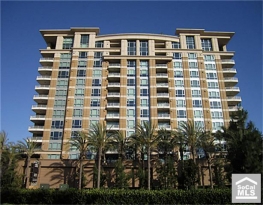
Irvine Home Address … 3101 SCHOLARSHIP Irvine, CA 92612

Resale Home Price …… $880,000

Rise up this mornin'; smiled with the risin' sun.

Three little birds pitch by my doorstep

Singin' sweet songs of melodies pure and true; saying,

“This is my message to you-ou-ou.”

Singin': “Don't worry about a thing,

‘cause ev-ry little thing gonna be all right.”

Bob Marley — Three Little Birds

Is everything going to be all right? Every press release from the National Association of realtors would lead you to believe so. Remember the post on how realtors spin data?

Data: Factual statements that present statistics or some measurable phenomenon. Presenting data is ostensibly the reason for a real estate press release. However, the real intention is to spin the data or otherwise manipulate the interpretation.

Spin: The offered interpretation of data that forwards the agenda of the organization issuing the press release. Spin is usually a plausible interpretation that is most often taken out of context, knowingly, by the authors.

Bullshit: An interpretation of data that is either not factual, or the data itself is not factual, or an interpretation that is not plausible based on the data. Bullshit is an obvious lie an organization passes off to a gullible public in hopes that nobody catches on.

The color coding of text above will be used to help decipher the nonsense that follows.

Because the current data is so bad, the NAr set the spin cycle on high for their first quarter report.

Existing-Home Sales Rise in Most States in First Quarter; Metro Area Prices Mixed

Washington, DC, May 10, 2011

Existing-home sales continued to recover in the first quarter with gains recorded in 49 states and the District of Columbia, while 22 percent of the available metropolitan areas saw prices rise from a year ago, according to the latest survey by the National Association of realtors®.

Home sales did not recover in the first quarter. In fact, they are off considerably. While it may be technically factual that gains were recorded in 49 states, it only takes one reporting location to make that statement true. Nearly every state and the nation as a whole saw declines in sales and in prices. Further, if only 22 percent of MSAs saw prices rise, then 78% saw prices go down. The NAr bullshit doesn't pass the giggle test.

Total state existing-home sales, including single-family and condo, rose 8.3 percent to a seasonally adjusted annual rate1 of 5.14 million in the first quarter from 4.75 million in the fourth quarter, and are only 0.8 percent below a 5.18 million pace during the same period in 2010.

Sales always rise from the 4th quarter to the 1st. Leading off with that spun data point leads them to the far more damaging reality that sales are down from last years anemic levels.

Also in the first quarter, the median existing single-family home price rose in 34 out of 153 metropolitan statistical areas (MSAs) from the first quarter of 2010, including four with double-digit increases; one was unchanged and 118 areas showed price declines.

That is one of the most egregious statements of bullshit I have seen the NAr put out. If prices are falling in 118 out of 153 MSAs, that is 78% of the market. Prices are falling in 78% of the markets surveyed. Read their statement again. Didn't is sound positive? The bullshit lead discusses how many MSAs where the prices are going up. Unbelievable… well, actually this is the NAr.

Now let's hear from the master bullshitter, Lawrence Yun.

Lawrence Yun, NAR chief economist, said home prices are all over the map. “The reading of quarterly price data can be volatile because they are based on the types of homes that are sold during the quarter. When buyers principally purchase distressed properties in a given market, the recorded prices will be very low, which is what we’re seeing now in much of the country,he said. “Annual price data provides a better guide about the direction of the market in those areas.

The national median existing single-family home price was $158,700 in the first quarter, down 4.6 percent from $166,400 in the first quarter of 2010.

I think Yun forgot to proofread his own press release. He was trying to spin the data by saying the annual price change is a better guide, but then he followed with the fact that house prices are down significantly from last year.

He's right about this one. The momentum from last years declines will likely carry forward to the foreseeable future.

The median is where half sold for more and half sold for less. Distressed homes, typically sold at a discount of about 20 percent, accounted for 39 percent of first quarter sales, up from 36 percent a year earlier.

That is some very bad data. How do you think he will spin it?

To clarify, Yun said lower priced homes have seen the best sales performance. The biggest sales increase has been in the lower price ranges, which are popular with investors and cash buyers,he said. “The preponderance of sales activity at the lower end is bringing down the median price, so what we’re seeing is the result of a change in the composition of home sales.

First he is spinning the data by discussing investors and cash buyers. The reality is sales are higher in lower price ranges because that is what people can afford. Affordability is driving sales away from bloated high-end properties toward affordable low-end ones.

He is suggesting in his bullshit that the median home price is artificially low due to a change in mix and things are not as bad as they seem. The fact is high-end prices are too high, credit availability is low, and the buyer pool is seriously depleted. High-end homes will continue to sell slowly until the prices are lowered to affordable levels.

Although sales are slightly below a year ago, the volume of homes sold for $100,000 or less in the first quarter was 8.9 percent higher than the first quarter of 2010, creating a downward skew on the overall median price. The share of all-cash home purchases rose to 33 percent in the first quarter from 27 percent in the first quarter of 2010.

Investors accounted for 21 percent of first quarter transactions, up from 18 percent a year ago, while first-time buyers purchased 32 percent of homes, down from 42 percent in the first quarter of 2010 when a tax credit was in place. Repeat buyers accounted for a 47 percent market share in the first quarter, up from 40 percent a year earlier.

The tax credit definitely pulled forward first-time homebuyer demand. The decline in sales to first-time buyers is not a good sign for a housing market that needs household formation and first-time buyers to mop up the REO inventory.

The rising sales trend in nearly all states is a part of the healing process to clear off inventory. Sales need to rise before prices can firm up,” Yun added.

Another damaging truth he forgot to spin. Sales do need to rise before prices can firm up. That's why declining sales during a period of the year when they should be increasing is worrying to market analysts.

NAR President Ron Phipps, broker-president of Phipps Realty in Warwick, R.I., said strong sales of distressed homes are exactly what the market needs. “The good news is foreclosures, which account for two-thirds of all distressed homes sold, are selling very quickly,” he said. “Short sales still take far too long to get lender approval, but it appears the inventory of distressed property is peaking and will be gradually declining next year. This means the market should slowly return to balance. We are encouraged that recent home buyers are having exceptionally low default rates.

If two-thirds of sales are distressed properties, prices are going to go down. He spins the data by saying these are selling quickly, but based on the data above, that is bullshit.

If the inventory of distressed homes won't peak until later this year and begin to decline next year, what is the urgency to buy?

Recent home buyers are not having exceptionally low default rates unless you are comparing their default rates to the garbage loans underwritten at much higher prices during the 00s. Current default rates are still elevated well above historic norms even for the newest vintage of loans because prices are still falling and most recent buyers with low down payments are already under water.

The rest of the report is data, so I will spare you the green text. I have highlighted the interesting facts to bring them to your attention.

According to Freddie Mac, the national commitment rate on a 30-year conventional fixed-rate mortgage averaged 4.85 percent in the first quarter, up from a record low 4.41 percent in the fourth quarter, but below the 5.00 percent average in the first quarter of 2010.

In the condo sector, metro area condominium and cooperative prices – covering changes in 53 metro areas – showed the national median existing-condo price was $152,900 in the first quarter, down 10.4 percent from the first quarter of 2010. Eleven metros showed increases in the median condo price from a year ago, one was unchanged and 41 areas had declines.

The condo market is a shambles. Prices are down more than 10% year-over-year, and prices have declined in 77% of the MSA polled. That is horrible.

Regionally, existing-home sales in the Northeast increased 0.8 percent in the first quarter to a level of 800,000 but are 7.3 percent below the first quarter of 2010. The median existing single-family home price in the Northeast declined 5.0 percent to $234,100 in the first quarter from a year ago.

Existing-home sales in the Midwest rose 7.9 percent in the first quarter to a pace of 1.09 million but are 5.0 percent below a year ago. The median existing single-family home price in the Midwest fell 5.3 percent to $124,400 in the first quarter from the same period in 2010.

In the South, existing-home sales increased 8.5 percent in the first quarter to an annual rate of 1.96 million and are 2.8 percent higher than the first quarter of 2010. The median existing single-family home price in the South slipped 0.6 percent to $141,800 in the first quarter from a year earlier.

Existing-home sales in the West jumped 13.5 percent in the first quarter to a level of 1.29 million and are 2.1 percent above a year ago. The median existing single-family home price in the West fell 4.7 percent to $197,400 in the first quarter from the first quarter of 2010.

Did you notice that in every region prices declined? Sales were mixed, but the price drops were uniform. Nothing in this press release was encouraging, and for an organization dedicated to creating false urgency in buyers, it's very difficult to spin to their advantage. Perhaps someday, they won't try? I'm not holding my breath.

$1,093 HOA dues

Today's featured property is a flip in Avenue One, an Irvine high rise that never should have been built. It's a standard flip from what I can tell. My data source does not have the purchase record on this property. I was surprised by this seller believing they could fetch a price that the previous seller could not get last year when prices were higher. Perhaps he believes the property is now more valuable because he owns it. Or perhaps he is a delusional fool who will either lose money or fail to sell the property.

Property History for 3101 SCHOLARSHIP

Date Event Price
May 04, 2011 Listed (Active) $880,000
Dec 30, 2010 Sold (MLS) (Closed) $700,000
Dec 23, 2010 Pending (Backup Offers Accepted)
Oct 22, 2010 Price Changed $798,500
Oct 20, 2010 Price Changed $799,500
Oct 06, 2010 Price Changed $829,500
Jul 15, 2010 Listed (Active) $849,500

The HOA dues in these towers are shocking. With monthly cash outlays exceeding $5,500 and a cost of ownership exceeding $4,300 per month, why would anyone buy one of these?

Oh yeah, prices are going back up…

Irvine House Address … 3101 SCHOLARSHIP Irvine, CA 92612

Resale House Price …… $880,000

House Purchase Price … $700,000

House Purchase Date …. 12/30/2010

Net Gain (Loss) ………. $127,200

Percent Change ………. 18.2%

Annual Appreciation … 56.2%

Cost of House Ownership

————————————————-

$880,000 ………. Asking Price

$176,000 ………. 20% Down Conventional

4.62% …………… Mortgage Interest Rate

$704,000 ………. 30-Year Mortgage

$155,033 ………. Income Requirement

$3,617 ………. Monthly Mortgage Payment

$763 ………. Property Tax (@1.04%)

$0 ………. Special Taxes and Levies (Mello Roos)

$183 ………. Homeowners Insurance (@ 0.25%)

$0 ………. Private Mortgage Insurance

$1093 ………. Homeowners Association Fees

============================================

$5,656 ………. Monthly Cash Outlays

-$868 ………. Tax Savings (% of Interest and Property Tax)

-$907 ………. Equity Hidden in Payment (Amortization)

$305 ………. Lost Income to Down Payment (net of taxes)

$130 ………. Maintenance and Replacement Reserves

============================================

$4,316 ………. Monthly Cost of Ownership

Cash Acquisition Demands

——————————————————————————

$8,800 ………. Furnishing and Move In @1%

$8,800 ………. Closing Costs @1%

$7,040 ………… Interest Points @1% of Loan

$176,000 ………. Down Payment

============================================

$200,640 ………. Total Cash Costs

$66,100 ………… Emergency Cash Reserves

============================================

$266,740 ………. Total Savings Needed

Property Details for 3101 SCHOLARSHIP Irvine, CA 92612

——————————————————————————

Beds: 2

Baths: 2

Sq. Ft.: 1715

$513/SF

Property Type: Residential, Condominium

Style: One Level, High or Mid-Rise Condo

View: City Lights, City, Faces West

Year Built: 2008

Community: Airport Area

County: Orange

MLS#: U11001952

Source: SoCalMLS

Status: Active

——————————————————————————

A perfect 10! Located in one of Irvine's most exclusive, prestigious and sought after communities, this 2 bedroom and a den stylish 10th floor, high-end luxury high-rise home boasts the picturesque city view during the day, and gorgeous city lights view at night; this home will absolutely take your breath away. A jaw dropping gourmet kitchen with granite counter tops, marble flooring and all built-in Viking appliances. Community ammenties include rooftop pool and firepit, a large oversized clubroom with full gourmet catering kitchen, outdoor bar-b-ques, indoor gym, and a wine room with private storage locker, 24 hour lobby attendant and concierge service. HOA dues includes: internet, TV, water, gas, trash, insurance, 2 parking spaces, storage space and numerous guest parking. With so many upgrades throught out this home, this hidden gem is a must see. Call for appointment today!

ammenties? throught?

Have a great weekend,

Irvine Renter
Strategic default rises as house prices fall, 28% now underwater

Falling house prices are pushing more loan owners underwater and into strategic default.

Irvine Home Address … 14 ROCKY Knl Irvine, CA 92612

Resale Home Price …… $799,900

i'm underwater

i feel the flood begin

we're flesh and bone

together and alone

and we're looking for a home

Delerium — Underwater

More than 28% of US homeowners underwater on their mortgage

by JASON PHILYAW — Monday, May 9th, 2011, 8:55 am

Home values in the first quarter fell 3% from the prior quarter and are now nearly 30% lower than the June 2006 peak.

Real estate data analytics firm Zillow said its home value index for the first three months of 2011 declined 8.2% from a year earlier to $169,600. The first-quarter decline was the steepest since 2008.

Zillow now doesn't expect home values to reach bottom before 2012, “at the earliest.”

“Home value declines are currently equal to those we experienced during the darkest days of the housing recession,” Zillow Chief Economist Stan Humphries said. “With accelerating declines during the first quarter, it is unreasonable to expect home values to return to stability by the end of 2011. We did expect substantial payback from the homebuyer tax credits, which buoyed the housing market last year, but underlying demand post-tax credit, as well as rising foreclosures and high negative equity rates, make it almost certain that we won't see a bottom in home values until 2012 or later.”

The level of single-family homeowners who owe more on their mortgage than the property is worth rose to a new high of 28.4% at March 31, up from 27% at the end of 2010, according to Zillow.

The percentage underwater is very important because strategic defaults go up significantly when home owners become loan owners as evidenced by the dismal cure rates on underwater loans.

As the author of our next article points out, the 28% figure above is misleading. The truth is more dire. These studies of underwater loan owners only considers the first mortgage. When you factor in the total debt on the property and include the second mortgages and HELOCs, the percentage who are underwater is much higher than 28%.

Strategic defaults could get very ugly

May 4, 2011, 2:01 p.m. EDT– By Keith Jurow

BRIDGEPORT, Conn. (MarketWatch) — In an article posted last September I discussed the growing threat that so-called “strategic defaults” posed to major metros which had experienced a housing bubble.

With home prices showing renewed weakness again, now is a good time to revisit this important issue. See Strategic defaults threaten all major U.S. housing markets

I define a strategic defaulter to be any borrower who goes from never having missed a payment directly into a 90-day default. A good graph, which I will discuss shortly, illustrates my definition.

For purposes of statistical analysis, his definition is useful because it is an easily identifiable trait which can only be explained by a sudden and conscious decision. However, it doesn't pick up the millions of strategic defaulters who struggle for a time juggling payments until they either give up or run out of resources. Many borrowers finally give up after missing some payments, getting behind, and realizing they can never dig out.

Who walks away from their mortgage?

When home prices were rising rapidly during the bubble years of 2003-2006, it was almost inconceivable that a homeowner would voluntarily stop making payments on the mortgage and lapse into default while having the financial means to remain current on the loan.

Then something happened which changed everything. Prices in most bubble metros leveled off in early 2006 before starting to decline. With certain exceptions, home prices have been falling quite steadily since then around the country. In recent memory, this was something totally new and it has radically altered how most homeowners view their house. In those major metros where prices soared the most during the housing bubble, homeowners who have strategically defaulted share three essential assumptions:

The value of their home would not recover to their original purchase price for quite a few years.

• They could rent a house similar to theirs for considerably less than what they were paying on the mortgage.

• They could sock away tens of thousands of dollars by stopping mortgage payments before the lender finally got around to foreclosing.

Put yourself into the mind and shoes of an underwater homeowner who held these three assumptions. Can you see how the temptation to default might be difficult to resist?

Those are the standard reasons for strategic default we have discussed at length on this blog. They are good reasons. Anyone facing those circumstances will benefit financially from walking away. That's why strategic default is so common and will become the norm before this crisis has past.

In fact, one of the primary reasons lenders should never loan money when the rental cashflow doesn't cover the loan payment is because it exposes them to strategic default risk. There is no amount of signatory assurance that will prevent strategic default. The only way lenders can limit their risk effectively is to make sure that the property can cover the payments even if the borrower cannot.

Who doesn’t walk away?

… Last year, two important studies were published which have tried to get a handle on strategic defaults. First came an April report by three Morgan Stanley analysts entitled “Understanding Strategic Defaults.”

The study analyzed 6.5 million anonymous credit reports from TransUnion’s enormous database while focusing on first lien mortgages taken out between 2004 and 2007.

The authors found that loans originated in 2007 had a significantly higher percentage of strategic defaults than those originated in 2004. The following chart clearly shows this difference.

Why are the 2007 borrowers strategically defaulting much more often than the 2004 borrowers? Prices were rising rapidly in 2004 whereas they were falling in nearly all markets by 2007. So the 2007 loans were considerably more underwater than the 2004 loans.

Note also that the strategic default rate rises very sharply at higher Vantage credit scores. (Vantage scoring was developed jointly by the three credit reporting agencies and now competes with FICO scoring.)

Another chart shows us that even for loans originated in 2007, the strategic default percentage climbs with higher credit scores.

Notice in this chart that although the percentage of all loans which defaulted declines as the Vantage score rises, the percentage of defaults which are strategic actually rises.

A safe conclusion to draw from these two charts is that homeowners with high credit scores have less to lose by walking away from their mortgage. The provider of these credit scores, VantageScore Solutions, has reported that the credit score of a homeowner who defaults and ends up in foreclosure falls by an average of 21%. This is probably acceptable for a borrower who can pocket perhaps $40,000 to $60,000 or more by stopping the mortgage payment.

Most people overestimate how damaging strategic default, short sale, or foreclosure are going to be on their credit score. This is a perception lenders foster because if everyone facing strategic default realized how light the punishments really are, nearly everyone would do it.

Further, some people facing strategic default see the light and realize their credit score doesn't matter at all if they simply abstain from using credit. If you have no desire to use credit, your FICO score could fall to zero, and it wouldn't impact your life.

Why do homeowners strategically default?

Is there a decisive factor that causes a strategic default? To answer this, we need to turn to the other recent study.

Last May, a very significant analysis of strategic defaults was published by the Federal Reserve Board. Entitled “The Depth of Negative Equity and Mortgage Default Decisions,” it was extremely focused in scope. The authors examined 133,000 non-prime first lien purchase mortgages originated in 2006 for single-family properties in the four bubble states where prices collapsed the most — California, Florida, Nevada, and Arizona. All of the mortgages provided 100% financing with no down payment.

By September 2009, an astounding 80% of all these homeowners had defaulted. Half of these defaults occurred less than 18 months from the origination date. During that time, prices had dropped by roughly 20%. By September 2009 when the study’s observation period ended, median prices had fallen by roughly another 20%.

People who stretched to buy at the peak were counting on mortgage equity withdrawal to afford their payments and their lifestyles. When it became obvious that money was not going to materialize, the borrowers bailed.

This study really zeroes in on the impact which negative equity has on the decision to walk away from the mortgage. Take a look at this first chart which shows strategic default percentages at different stages of being underwater.

Notice that the percentage of defaults which are strategic rises steadily as negative equity increases. For example, with FICO scores between 660 and 720, roughly 45% of defaults are strategic when the mortgage amount is 50% more than the value of the home. When the loan is 70% more than the house’s value, 60% of the defaults were strategic.

This last chart focuses on the impact which negative equity has on strategic defaults based upon whether or not the homeowner missed any mortgage payments prior to defaulting.

This chart shows what I consider to be the best measure of strategic defaulters. It separates defaulting homeowners by whether or not they missed any mortgage payments prior to defaulting. As I see it, a homeowner who suddenly goes from never missing a mortgage payment to defaulting has made a conscious decision to default.

The chart reveals that when the mortgage exceeds the home value by 60%, roughly 55% of the defaults are considered to be strategic. For those strategic defaulters who are this far underwater, the benefits of stopping the mortgage payment outweigh the drawbacks (or “costs” as the authors portray it) enough to overcome whatever reservations they might have about walking away.

Each borrower has a different tolerance for financial pain. Some bail as soon as they go underwater, and some wait until they are deeply submerged. In markets like Las Vegas where over 80% of loan owners are deeply underwater, even the most upstanding morally guided borrowers with firm beliefs about paying their mortgage will walk away.

Where do we go from here?

The implications of this FRB report are really grim. Keep in mind that 80% of the 133,000 no-down-payment loans examined had gone into default within three years. Clearly, homeowners with no skin in the game have little incentive to continue paying the loan when the property goes further and further underwater.

While the bulk of the zero-down-payment first liens originated in 2006 have already gone into default, there are millions of 80/20 piggy-back loans originated in 2004-2006 which have not.

We know from reports issued by LoanPerformance that roughly 33% of all the Alt A loans securitized in 2004-2006 were 80/20 no-down-payment deals. Also, more than 20% of all the subprime loans in these mortgage-backed security pools had no down payments.

Here is the most ominous statistic of them all. In my article on the looming home equity line of credit (HELOC) disaster posted here in early September Home Equity Lines of Credit: The Next Looming Disaster?, I pointed out that there were roughly 13 million HELOCs outstanding. This HELOC madness was concentrated in California where more than 2.3 million were originated in 2005-2006 alone.

Last April I reported that Banks refuse to recognize HELOC and second mortgage losses. Negotiations with these second lien holders is primarily what holds up short sales.

How many of these homes with HELOCs are underwater today? Roughly 98% of them, and maybe more. Equifax reported that in July 2009, the average HELOC balance nationwide for homeowners with prime first mortgages was nearly $125,000. Yet the studies which discuss how many homeowners are underwater have examined only first liens. It’s very difficult to get good data about second liens on a property.

So if you’ve read that roughly 25% of all homes with a mortgage are now underwater, forget that number. If you include all second liens, It could easily be 50%. This means that in many of those major metros that have experienced the worst price collapse, more than 50% of all mortgaged properties may be seriously underwater.

Realistically, the only thing that kept most of these people paying since early 2009 was the false bottom engineered by the federal reserve. Many more borrowers will strategically default now that prices are falling and hopes of a price recovery are flagging.

The Florida collapse

Nowhere is the impact of the collapse in home prices more evident than in Florida. The three counties with the highest percentage of first liens either seriously delinquent or in pre-foreclosure (default) are all located in Florida. According to CoreLogic, the worst county is Miami-Dade with an incredible 25% of all mortgages in serious distress and headed for either foreclosure or short sale.

An article posted on the Huffington Post in mid-January 2011 describes the Florida “mortgage meltdown” in grim detail. Written by Floridian Mark Sunshine, it begins by pointing out that 50% of all the residential mortgages currently sitting in private, non-GSE mortgage-backed securities (MBS) were more than 60 days delinquent — either seriously delinquent, in default, bankruptcy, or already foreclosed by the bank. I checked his source — the American Securitization Forum — and the percentage was correct.

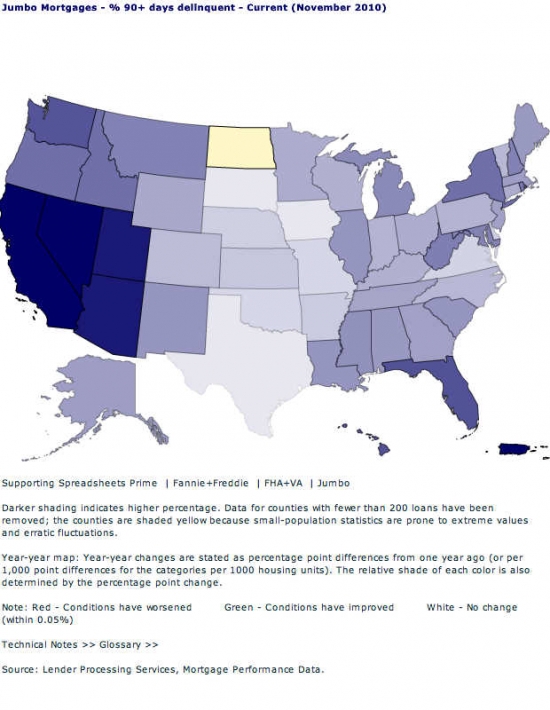
for more details on mortgage delinquencies by product type, see the interactive graph at the Federal Reserve Bank of New York. Below is the graph for delinquent jumbo loans. Orange County, California has 8.3% delinquent. Apparently local wages don't support the jumbo loans underwritten here.

The author then goes on to discuss a strategic default situation among his friends in Florida. One of them had purchased a condo in early 2007 for $300,000. By mid-2010, it had plunged in value to less than $100,000 and he decided to stop paying the mortgage. When he expressed his concerns about the possible consequences to his buddies — including an attorney, an accountant, and a doctor — all expressed the same advice to him. They told him to walk away from the mortgage, save his money, and prepare to move to a rental unit. To them, it seemed like a no-brainer.

The author was a little surprised that no one thought there was anything wrong with strategically defaulting. The attorney actually suggested that the defaulter file for bankruptcy to prevent the bank from going after a deficiency judgment for the remaining loan balance after the repossessed property was sold.

The attorney was providing sound advice. After a strategic default or a foreclosure on a recourse loan, borrowers should declare bankruptcy. Lenders are merely laying in the weeds waiting for borrowers to become solvent again before pursuing collections. No lender has forgotten they are owed money.

The conclusion expressed by the author has far-reaching implications. As he saw it, “More and more Floridians who pay their mortgage feel like chumps compared to defaulters; they turn over their disposable income to the bank and know it will take most of their lifetimes to recover.

As prices slide to new lows in metro after metro, will this attitude toward defaulting spread from Florida to more and more of the nation? A May 2010 Money Magazine survey asked readers if they would ever consider walking away from their mortgage. The results were sobering indeed:

• Never: 42%

• Only if I had to: 38%

• Yes: 16%

• Already have: 4%

In late January of this year, a report on strategic defaults issued by the Nevada Association of Realtors seemed to confirm the findings of the two studies I’ve discussed. The telephone survey interviewed 1,000 Nevada homeowners. One question asked was this: “Some homeowners in Nevada have chosen to undergo a ‘strategic default’ and stop making mortgage payments despite having the ability to make the payments. Some refer to this as ‘walking away from a mortgage.’ Would you describe your current or recent situation as a ‘strategic default?’”

Of those surveyed, 23% said they would classify their own situation as a strategic default. Many of those surveyed said that trusted confidants had advised them that strategic default was their best option. One typical response was that the loan “was so upside down it would never have been okay.”

What seems fairly clear from this Nevada survey and the two reports I’ve reviewed is that as home values continue to decline and loan-to-value (LTV) ratios rise, the number of homeowners choosing to walk away from their mortgage obligation will relentlessly grow. That means growing trouble for nearly all major housing markets around the country.

Strategic default is the snowball increasing in size as it rolls down hill. Even Fannie Mae has noted that nearly twice as many borrowers think its okay to walk away from their mortgages than just on year ago (more on that later)

The momentum of this second leg down in pricing will likely pick up speed as more and more borrowers strategically default. The only option lenders have is to increase shadow inventory and allow more squatting, but that will in turn encourage more strategic default because borrowers know they get an extended period of free housing.

The herd is spooked, and the stampeded that follows will lead to Las Vegas style market capitulation in many other markets around the country.

He changed his mind

One change in the market I have noted this spring is the number of heavy-cash or all-cash buyers from the bear rally who are bailing out. After two years of negative cashflow and no appreciation to show for it, many FCBs are becoming impatient.

The owner of today's featured property paid $755,000 on 12/26/2008. He used a $417,000 first mortgage and a $338,000 down payment. Like many before him, he is pricing the property at breakeven in hopes a greater fool will come along.

I don't think that greater fool exists in this market. We will see.

Irvine House Address … 14 ROCKY Knl Irvine, CA 92612

Resale House Price …… $799,900

House Purchase Price … $755,000

House Purchase Date …. 12/26/2008

Net Gain (Loss) ………. ($3,094)

Percent Change ………. -0.4%

Annual Appreciation … 2.4%

Cost of House Ownership

————————————————-

$799,900 ………. Asking Price

$159,980 ………. 20% Down Conventional

4.62% …………… Mortgage Interest Rate

$639,920 ………. 30-Year Mortgage

$140,921 ………. Income Requirement

$3,288 ………. Monthly Mortgage Payment

$693 ………. Property Tax (@1.04%)

$0 ………. Special Taxes and Levies (Mello Roos)

$167 ………. Homeowners Insurance (@ 0.25%)

$0 ………. Private Mortgage Insurance

$380 ………. Homeowners Association Fees

============================================

$4,528 ………. Monthly Cash Outlays

-$789 ………. Tax Savings (% of Interest and Property Tax)

-$824 ………. Equity Hidden in Payment (Amortization)

$277 ………. Lost Income to Down Payment (net of taxes)

$120 ………. Maintenance and Replacement Reserves

============================================

$3,312 ………. Monthly Cost of Ownership

Cash Acquisition Demands

——————————————————————————

$7,999 ………. Furnishing and Move In @1%

$7,999 ………. Closing Costs @1%

$6,399 ………… Interest Points @1% of Loan

$159,980 ………. Down Payment

============================================

$182,377 ………. Total Cash Costs

$50,700 ………… Emergency Cash Reserves

============================================

$233,077 ………. Total Savings Needed

Property Details for 14 ROCKY Knl Irvine, CA 92612

——————————————————————————

Beds: 5

Baths: 3

Sq. Ft.: 3100

$258/SF

Property Type: Residential, Condominium

Style: 3+ Levels, Other

View: City Lights, City

Year Built: 1975

Community: Turtle Rock

County: Orange

MLS#: P779956

Source: SoCalMLS

Status: Active

——————————————————————————

The model E has been modified and the downstairs storage areas have been converted to a large bedroom and bathroom on the ground floor. Huge living spaces, two fireplaces and gorgeous hand scraped hard wood floors. Large master bedroom with huge views over the city of Irvine and a spacious bathroom with separate shower and tub, double sinks and walk in closet. There is a separate laundry room, off the huge kitchen with gorgeous granite counter tops and new dishwasher and a private outside patio just right for BBQ's and a quiet morning coffee and paper reading! New upgraded carpet and padding throughout and Italian porcelain tile on the bathroom and kitchen floors. New fittings and fixtures in wetbar and bathrooms and kitchen, just move in!! What a FIND!

Are government house price supports working?

House price supports engineered by policy in Washington are successful in some markets and failures in others.

Irvine Home Address … 27 RESERVE Irvine, CA 92603

Resale Home Price …… $2,900,000

Oh, I get by with a little help from my friends,

Mmm, gonna try with a little help from my friends

Ooh, I get high with a little help from my friends

Beatles — A Little Help From My Friends

in a move to save our banking system, Ben Bernanke and friends took extraordinary efforts to prop up the housing market.

They failed.

The recent double dip in house prices makes it official: the 2009 bottom built on government props was not durable.

Clear Capital® Reports National Double Dip

U.S. home prices double dip as West, South and Northeast regions fall prey to the last grip of winter.

TRUCKEE, CA – May 5, 2011 – Clear Capital (www.clearcapital.com) today released its monthly Home Data Index™ (HDI) Market Report, and reports prices have double dipped nationally 0.7 percent below prior lows experienced in March 2009. This month’s HDI Market Report provides the most current (through April 2011) and relevant analysis of how local markets performed compared to the national trend in home prices.

Report highlights include:

  • National quarterly home prices changed -4.9%; while year-over-year national price changes reached -5.0%.
  • National home prices have fallen 11.5% over the previous nine-month period, a rate of decline not experienced since 2008.
  • In a sign of the continued volatility and fragility of home prices, all the major Metropolitan Statistical Areas (MSA) tracked in this month’s report showed quarter-over-quarter price declines.
  • National REO saturation rate reaches 34.5%.

“The latest data through April shows a continued increase in the proportion of distressed sales that are taking hold in markets nationwide,” said Dr. Alex Villacorta, director of research and analytics at Clear Capital. “With more than one-third of national home sales being REO, market prices are being weighed down as many markets have not regained enough footing to withstand the strain of the high proportion of REO sales.

One of the mantras of housing bears over the last four years has been the inventory is coming. Of course the bulls dismissed this argument because the banks withheld the inventory, and it didn't appear on the MLS. Many bulls even denied this inventory exists. The facts are that shadow inventory is real, and banks are attempting to meter out properties to the MLS at a rate that doesn't crash prices. However, they are a cartel, and with prices falling and time passing, the pressure to exit the market is growing, and the cartel is starting to fall apart.

In light of the compounding effects of winter’s seasonal slowdown and increased distressed sale activity, the market now faces the true test of whether prices can rebound in the historically active spring season,” added Villacorta.

As national home prices reached new lows this past winter, hopes remain for a spring revival. Markets have entered uncharted territory, however, as this current home buying season will be the first since 2008 without any tax credit incentive. A note of caution to those looking for a strong end to 2011: The last time no incentives were in place and distressed inventories were this high, home prices fell sharply.

The biggest surprise of this years spring selling season has been the lack of volume and continued price declines. Like most housing analysts, I expected some sort of spring rally. So far, no spring rally has materialized. If sales are weak and prices are dropping in a historically vibrant time of year, what is going to happen this fall?

Areas like Irvine could be particularly hard hit by the fall drop because jumbo loan limits are also falling. Less government support means higher interest costs, lower loan balances, and fewer qualified buyers. Who are the banks going to sell their overpriced houses to?

Home Price and REO Saturation Parallels to 2008

Past market reports have shown periods of stabilization. Movements of home prices certainly have been less dramatic than during the start of the downturn in 2006, and two years of mixed seasonal gains and losses have given the appearance that prices are stabilizing, or at least bouncing along a trough.

This assumption of stabilization also considers the last two years have marked a period of external stimulus in the form of tax credits. As an alternative and cautionary reference, below is a comparison between the housing market from spring 2008, through the end of the year; compared to the post tax credit period of late 2010 through April 2011.

National REO Saturation (2008 to 2011)

Last month's HDI Market Report (released April 7, 2011) noted the subtle but rather ominous trend that distressed sales activity in the West, as a percentage of total sales, had climbed after a prolonged 18-month period of general improvements. Nationally, a similar trend has formed with REO saturation climbing to a current level of 34.5 percent after it declined to near 20 percent in mid-2010. Strikingly similar, 2008 saw REO saturation grow from the near 20 percent early in the year to 32 percent by the end of 2008.

National Home Price Change (2008 to 2011)

Looking at home price trends during these same two periods ties together similarities, with a 15.6 percent price decline for the 2008 timeframe compared to the 11.5 percent decline for the mid-2010 through April 2011 period.

This comparison leads to concern over home price declines through the rest of 2011. The trends of 2008 were quickly reversed with the introduction of stimulus measures. However, home prices today are already down nearly 25 percent since the 2008 period, creating increasing home affordability, in addition to gradually improving employment measures. Unlike the 2008 period where the downward trend ended in the winter, we're now heading into the home buying seasons of spring and summer. Regardless, the housing market still faces many challenges that will only be solved through increased buying activity or a reduction in the distressed segment―neither of which is assured in 2011.

That is a very insightful analysis. Distressed inventory is what pushes prices lower. Banks know this, so they embarked on the amend-extend-pretend policy in 2008, they stopped foreclosing on delinquent borrowers, and they amassed a huge shadow inventory.

Amend-extend-pretend: a different kind of crash

One of the big unknowns of the housing bubble is whether or not the policies of the government designed to prop up house prices will be successful in propping up house prices (it's a flawed policy I hope will fail). To date, the policy has failed miserably in Las Vegas, and it has succeeded in Orange County — so far.

As you can see from the chart above, prices in Clark County, Nevada, where Las Vegas is, have fallen well below historic trendlines. This is the main reason I am very bullish on this market. When prices are 40% below where they should be, the cashflow is excellent.

Since prices fell below their historic trendlines, sales volumes have been up. In fact, sales in Las Vegas currently surpass the rate seen at the bubble peak in 2006.

In Orange County the story is very different.

Orange County house prices have not deflated from their bubble highs, and they are still overvalued by historic norms. Elevated prices and a depleted buyer pool have slowed Orange County sales to historic lows, more than 20% off the long term average and well below the sales rates at the bubble's peak.

The Orange County, California, home price premium over Clark County, Nevada

Orange County commands a house price premium over Clark County in direct proportion to the difference in household income. House prices are ultimately tethered to the incomes of the local population who buy houses, so an Orange County price premium around 2 is expected. It's the times when this ratio is out of whack that are instructive.

The housing bubble of the early 90s was experienced in California but not Nevada, so the premium was stretched to about 2.3. During the crash and foreclosure crisis that followed, Nevada house prices kept going up and California house prices went down. Relative to incomes, Orange County house prices were affordable in the mid 90s.

By 2002 house prices in California had recovered, and the state was busy inflating another housing bubble. In response to low affordability in California and other coastal areas, lenders came up with the Option ARM. This loan became very popular in Nevada and in California, and house prices in both states went to the moon.

When the amend-extend-pretend dance began in earnest, product was withheld from the Orange County market and prices temporarily stabilized, albeit at very low sales volumes. In Clark County, lenders were not successful in managing their inventories, and prices kept falling. As a result, the premium in Orange County has been stretched to extremes.

Realistically, what do you think is going to happen?

Will house prices go up in Las Vegas? Will house prices go down in Orange County? Will we embark on a new era where the Orange County premium is sustained at 3.5 where it's no longer supported by incomes?

Personally, I think we will see all of the above. When the foreclosure inventory is worked off, house prices in Las Vegas will stage a comeback to its historic trendline. Due to the foreclosure inventory, house prices in Orange County will continue to fall. It may be many years before the Orange County premium reverts to it's historic mean, but eventually house prices must equalize with income.

Perhaps Las Vegas will always remain a relative bargain. For local residents that would be a good thing.

All Cash buyers are bailing from the high end

Some small number of foreign cash buyers came to Irvine and bought the bear rally. These less-than savvy investors failed to recognize how inflated house prices were, and they overestimated the support other cash buyers would have on the market. Some of those buyers, like the sellers of today's featured property are bailing out and moving on.

It must be very disheartening to lose nearly $2 million because you bought a house in Irvine four years ago.

Irvine House Address … 27 RESERVE Irvine, CA 92603

Resale House Price …… $2,900,000

House Purchase Price … $4,508,000

House Purchase Date …. 4/27/2007

Net Gain (Loss) ………. ($1,782,000)

Percent Change ………. -39.5%

Annual Appreciation … -10.8%

Cost of House Ownership

————————————————-

$2,900,000 ………. Asking Price

$580,000 ………. 20% Down Conventional

4.62% …………… Mortgage Interest Rate

$2,320,000 ………. 30-Year Mortgage

$510,904 ………. Income Requirement

$11,921 ………. Monthly Mortgage Payment

$2513 ………. Property Tax (@1.04%)

$567 ………. Special Taxes and Levies (Mello Roos)

$604 ………. Homeowners Insurance (@ 0.25%)

$0 ………. Private Mortgage Insurance

$410 ………. Homeowners Association Fees

============================================

$16,015 ………. Monthly Cash Outlays

-$1782 ………. Tax Savings (% of Interest and Property Tax)

-$2989 ………. Equity Hidden in Payment (Amortization)

$1005 ………. Lost Income to Down Payment (net of taxes)

$382 ………. Maintenance and Replacement Reserves

============================================

$12,632 ………. Monthly Cost of Ownership

Cash Acquisition Demands

——————————————————————————

$29,000 ………. Furnishing and Move In @1%

$29,000 ………. Closing Costs @1%

$23,200 ………… Interest Points @1% of Loan

$580,000 ………. Down Payment

============================================

$661,200 ………. Total Cash Costs

$193,600 ………… Emergency Cash Reserves

============================================

$854,800 ………. Total Savings Needed

Property Details for 27 RESERVE Irvine, CA 92603

——————————————————————————

Beds: 6

Baths: 6

Sq. Ft.: 5600

$518/SF

Property Type: Residential, Single Family

Style: Two Level, Other

View: City, Ocean, Panoramic

Year Built: 2007

Community: Turtle Ridge

County: Orange

MLS#: S657320

Source: SoCalMLS

Status: Active

——————————————————————————

Exquisite La Cima estate w/ ocean & city light views. Exclusive guarded gated community. Completely designer upgraded(spent well over $800,000)property. Approx. 5600 sq. ft. 6 BR 6.5 Bath. residence crafted to combine magnificence of the indoors w/ the serenity of the outdoors. Additional master bedroom with bonus living room and kitchen equipped with finest appliances. Exposed sand blasted wood beams in ceilings. Central vaccum system. Elaborate laundry room with extra freezers, phone/internet connedctions. Form crown moldings throughout. Charming courtyard entrance, separate living suite(casita). Custom upgraded kitchen w/ large center island, formal dining room. Excellent surround sound throughout interior and exterior of house. Adjacent to Newport coast. Professional outdoor landscaping, w/ waterfalls & built in BBQ. Great amenities & more!
Why does someone need a freezer in a laundry room?

vaccum? connedctions?

Delinquent mortgage squatters provide $50 billion economic stimulus

Delinquent mortgage squatters are spending $50 billion this year stimulating the economy rather than paying their mortgages.

Irvine Home Address … 37 NAVARRE Irvine, CA 92612

Resale Home Price …… $395,000

I was a young boy that had big plans.

Now I'm just another shitty old man.

I don't have fun and I hate everything.

The world owes me, so F you.

Glory days don't mean shit to me.

I drank a six pack of apathy.

Life's a bitch and so am I.

The world owes me, so F you.

Green Day — The Grouch

Recently I wrote about The real Ponzis and posers of Irvine. Peggy Tanous of the Real Housewives of OC made a conscious decision to get a boob job rather than pay her rent. She is not alone.

The plastic surgeon undoubtedly appreciated the money, and any other provider of goods and services that received the Tanous's money did the same. The combined economic stimulus of all the delinquent mortgage squatters is estimated at $50 billion this year alone. Back in June of last year, I reported Strategic Default: The $10,000,000,000 Monthly Economic Stimulus.

The case could be made that our HELOC economy based on mortgage equity withdrawal and consumption has been replaced with a squatter rent economy based on people failing to pay their mortgages and spending that money instead.

In the astute observations recently some challenged me on why this upsets me so much. The real question is why doesn't it upset all of you? Does anyone want to see this behavior rewarded? With our tax money going to bail out the enabling banks, you and I as taxpayers are indirectly supporting these people.

You paid for part of Peggy Tanous's boob job.

I want a refund.

‘Squatter Rent’ May Boost Spending as Mortgage Holders Bail on Payments

By Bob Willis and John Gittelsohn – May 6, 2011 7:26 AM PT

Melissa White and her husband stopped paying their mortgage in May 2008 after it reset to $3,200 a month, more than double the original rate. That gave them extra cash to pay off debts and spend on staples until their Las Vegas home sold two years later for less than they owed.

“We didn’t pay it for about 24 months,” said White, who quit her job as a beautician during that period after becoming pregnant with her first child and experiencing medical complications. “What we had, we could put towards food and the truck payments and insurance and health things I was dealing with.”

The couple above aren't the only ones enjoying a payment-free lifestyle.

Millions of Americans have more money to spend since they fell delinquent on their mortgages amid the worst housing collapse since the Great Depression. They are staying in their homes for free about a year and a half on average, buying time to restructure their finances and providing an unexpected support for consumer spending, which makes up about 70 percent of the economy.

So-called “squatter’s rent,” or the increase to income from withheld mortgage payments, will be an estimated $50 billion this year, according to Michael Feroli, chief U.S. economist at JPMorgan Chase & Co. in New York. The extra cash could represent a boost to spending that’s equal to about half the estimated savings generated by cuts to payroll withholding in December’s bipartisan tax plan.

“We’ve had a lot of government transfers to the household sector; this is a transfer from the business sector to households,” Feroli said. “It’s a shock absorber that has helped the consumer ride out the storm.”

We have created a subsidy for the least deserving in our culture, and it is being spun as if it's an economic boost we should all be happy about. Mortgage squatting doesn't help out the American consumer, it only helps those consumers who are not paying their mortgages.

BTW, why don't we have rent modification programs? If renters become unemployed, why aren't we forcing landlords to lower their rent? Why doesn't the government allocate some TARP money to paying the rent of those who cannot afford it?

When a renter fails to pay their rent, for any reason, it's just assumed they should move out and find a more affordable place even if that is in the gutter. Loan owners get to apply for relief programs and government assistance not being offered to renters — programs renters are being forced to pay for. And if none of those programs offer satisfactory relief, loan owners get to squat in these houses indefinitely.

Now Renting

White, 28, now has two children, daughter Makenzie, 2, and son Christian, 1. She and her husband, Shannon, a sheet-metal worker, rent a house for $1,425 a month.

$1,425 per month in Las Vegas will rent a very nice property. Most rents in Las Vegas run between $1,000 and $1,200 per month. I'm not sure how an unemployed beautician and a sheet-metal worker afford that.

“My credit’s back,” she said. “I’d buy a house again, but I’d get a fixed-rate loan.”

At least they learned something of value for this experience. BTW, there are now loan offerings for people a day out of short sale. This family probably could get a loan. That won't contribute to strategic default, will it?

Consumer spending is projected to rise 2.8 percent this year, according to economists in an April Bloomberg News survey, after a 1.7 percent increase in 2010.

Delinquencies and defaults have helped homeowners save more, pay down other debts and move on to more affordable homes, according to Stan Humphries, chief economist at Zillow Inc., a Seattle-based provider of housing data. Owners in default need the savings because degraded credit scores from the default make it more difficult to borrow, he said.

“It’s bad that they’ve lost the home, but household finances have been rearranged in such a way that it’s arguably more sustainable,” Humphries said.

That reality is why we will continue to see strategic default, particularly once the general public realizes the 2009 bottom was an illusion.

Delinquent Debt

Van Perrault, a home appraiser who defaulted on his Saint Mary’s, Maryland, investment property in 2007 after his tenants stopped paying the rent, used the extra money to take care of late payments on his delinquent credit-card debt.

Do you think his tenants stopped paying the rent, or do you think he stopped paying the mortgage and skimmed their rent?

The additional $1,500 a month “made a difference in my life,” said Perrault, 60, adding that paying down his card balances helped him and his wife limit the damage to their credit scores.

Anyone who avoids paying a $1,500 monthly bill will find it makes a difference in their life. What's astonishing about this situation is that failing to pay their bills is being so handsomely rewarded.

Consumer debt fell to $11.4 trillion in the fourth quarter of 2010, down about $1.1 trillion from the peak in the third quarter of 2008, the Federal Reserve Bank of New York said in February. Mortgage debt dropped 9.1 percent in the period.

A total of 6.3 million homeowners weren’t current on their loans at the end of March, with 2.2 million in the process of foreclosure, according to data from Lender Processing Services Inc., a Jacksonville, Florida-based provider of mortgage- processing services and data. Loans in foreclosure were an average 549 days late.

If 6.3 million people haven't been making mortgage payments for nearly two years, you can see how the $50 billion adds up.

Conscious Decision

While many Americans couldn’t make payments because they lost their jobs or earned less during the recession, others made the conscious decision to stop paying — or carry out a so- called strategic default — on homes worth less than the outstanding obligation.

About 27 percent of single-family homeowners with mortgages, or about 15.7 million, were “underwater” at the end of last year, according to Zillow, the highest share since the first quarter of 2009, during the recession. Las Vegas led the nation, at 82 percent, followed by 70 percent for Phoenix.

Those numbers are shocking. Everyone in Las Vegas is underwater. The 18% that aren't include some recent buyers with large down payments and buyers from before the 00s who paid down their mortgages. It isn't very many people.

Failing to pay a mortgage bill is “a big moral issue,” said Karl Case, co-founder of a housing-price index that bears his name. “On the other hand, it’s exactly what you would expect given the way we treat and reward behavior in an economic system built for private gain.”

Strategic Default

More than a third of mortgage defaults were strategic, according to a June 2010 survey by finance professors Paola Sapienza of the Kellogg School of Management at Northwestern University and Luigi Zingales of the University of Chicago’s Booth School of Business. That was up from 29 percent in a March 2009 survey.

In Las Vegas that number is much, much higher. The people who believe they are paying because it's the right thing to do are being tested by market conditions. At some point, they have to wonder if they are doing the right thing for their families.

Almost half of Americans surveyed in January “said they would be more likely to default if their bank was accused of predatory lending, even if they’re morally opposed to strategic default,” Zingales said in a telephone interview from Chicago. “One likely reason for this may be related to a psychological notion of retribution.”

Adam Turner, 43, went eight months without making payments on his Las Vegas townhouse after he quit his job as a casino- restaurant wine steward in November 2009. He stopped paying as “a way of sticking it back to the banks” for pushing mortgages on people who shouldn’t have been qualified, he said. He sold the property in a July 2010 short-sale — when a bank agrees to accept less than the outstanding value of the loan.

When people want to take an action or make a decision they are morally uncomfortable with, it is quite common to seek out rationalizations and justifications. If they believe they have been victimized, even if it was by their own decisions, they can cloak their own misdeeds as bringing justice to an unjust situation.

Distressed Deals

Distressed deals — short sales and foreclosures — accounted for 40 percent of existing-home transactions in March, up from about one third last year, according to the Chicago- based National Association of Realtors.

With unemployment at 9 percent in April and forecast to average 8.7 percent for the full year — well above the 4.6 percent average in 2007 before the recession began — more Americans probably will enter the default pipeline this year. The number of homes receiving a foreclosure notice will climb about 20 percent, reaching a peak for the housing crisis, predicts RealtyTrac Inc., an Irvine, California-based data seller.

Turner, now a waiter and renting an apartment, used the money he saved by not making mortgage payments to take care of electric and phone bills and buy necessities while he was unemployed.

I wonder how he defined necessities….

“It definitely boosted my cash flow, which was helpful to move on with my life,” said Turner, who made almost $100,000 a year before the recession. “It was not like I was celebrating and partying. It was a rough time. It represented the American dream that collapsed around me.”

To contact the reporters on this story: Robert Willis in Washington at bwillis@bloomberg.net; John Gittelsohn in New York at johngitt@bloomberg.net

To contact the editors responsible for this story: Chris Wellisz at cwellisz@bloomberg.net; Kara Wetzel at kwetzel@bloomberg.net

(Almost) 20% down the drain

The owners of today's featured property are offering it as a short sale. Although they have not been served a NOD, in all likelihood, they are not paying the mortgage. Why would they? They credit is going to take a big hit either way.

I heard yesterday that FHA has guidelines which punish short sellers more severely if they also have missed payments, so perhaps there is some small incentive in the system to keep paying. The incentive to save two years of mortgage payments is arguably more enticing.

  • These owners paid $608,000 on 4/7/2006. They used a $456,000 first mortgage and a $152,000 down payment.
  • They refinanced on 8/30/2007 with a $482,400 first mortgage.
  • On 11/14/2007 they refinanced again with a $492,000 first mortgage.

They bought at the peak, and they still managed to squeeze out $36,000 of their down payment in mortgage equity withdrawal. Like most bubble era buyers, they undoubtedly expected the HELOC money ATM to go on forever.

They were wrong.

They bought a house they can't afford, and now they are selling it short.

Irvine House Address … 37 NAVARRE Irvine, CA 92612

Resale House Price …… $395,000

House Purchase Price … $608,000

House Purchase Date …. 4/7/2006

Net Gain (Loss) ………. ($236,700)

Percent Change ………. -38.9%

Annual Appreciation … -8.1%

Cost of House Ownership

————————————————-

$395,000 ………. Asking Price

$13,825 ………. 3.5% Down FHA Financing

4.62% …………… Mortgage Interest Rate

$381,175 ………. 30-Year Mortgage

$83,941 ………. Income Requirement

$1,959 ………. Monthly Mortgage Payment

$342 ………. Property Tax (@1.04%)

$0 ………. Special Taxes and Levies (Mello Roos)

$82 ………. Homeowners Insurance (@ 0.25%)

$438 ………. Private Mortgage Insurance

$395 ………. Homeowners Association Fees

============================================

$3,217 ………. Monthly Cash Outlays

-$317 ………. Tax Savings (% of Interest and Property Tax)

-$491 ………. Equity Hidden in Payment (Amortization)

$24 ………. Lost Income to Down Payment (net of taxes)

$69 ………. Maintenance and Replacement Reserves

============================================

$2,502 ………. Monthly Cost of Ownership

Cash Acquisition Demands

——————————————————————————

$3,950 ………. Furnishing and Move In @1%

$3,950 ………. Closing Costs @1%

$3,812 ………… Interest Points @1% of Loan

$13,825 ………. Down Payment

============================================

$25,537 ………. Total Cash Costs

$38,300 ………… Emergency Cash Reserves

============================================

$63,837 ………. Total Savings Needed

Property Details for 37 NAVARRE Irvine, CA 92612

——————————————————————————

Beds: 2

Baths: 3

Sq. Ft.: 1524

$259/SF

Property Type: Residential, Condominium

Style: Two Level, Villa

Year Built: 1978

Community: 0

County: Orange

MLS#: S656795

Source: SoCalMLS

Status: Active

On Redfin: 10 days

——————————————————————————

Two-story townhome–award-winning floor plan is bright and open with extra-high ceilings and has direct access to 2-car garage Two full bedrooms and baths upstairs. Master suite is huge. A den/office and full bath downstairs. Very private enclosed courtyard entry with lush plants. Remodeled kitchen is full of light and overlooks spacious open atrium/porch. Dual-pane windows and sliders. Baths remodeled. Easy-care wood-like tile flooring. Build-in wine rack, inside laundry, and more. Enjoy the Villas at RSJ, a unique, upscale comminity ideally located next to the golf course and the Racqet Club. Walk across the street to shops, restaurants, etc. Resort-like Pool and Spa. Near UCI, Senior Center, best schools and public transportation. Plus, HOA dues covers trash, water, and earthquake insurance.

Is Rancho San Joaquin upscale? comminity?

Fannie Mae and Freddie Mac losses at $164,400,000,000 and counting

Fannie May posted an $8.7 billion loss in the first quarter bringing total GSE losses to $164.4 billion so far. More losses are coming.

Irvine Home Address … 1 SOLANA #22 Irvine, CA 92612

Resale Home Price …… $550,000

Just look at all those hungry mouths we have to feed

Take a look at all the suffering we breed

So many lonely faces scattered all around

Searching for what they need

Is this the world we created?

we made it on our own

Is this the world we devastated

Right to the bone?

Queen — Is This the World We Created?

When the housing bubble became apparent to policy makers in Washington, they realized there was only one way to prevent a catastrophic collapse in house prices: they had to take over housing finance. To that end they took the GSEs into conservatorship, and the federal reserve began buying mortgage-backed securities at prices the free market was unwilling to pay. With both the delivery mechanism under direct government control and the ability to print money with through the federal reserve, aggregate loan balances were maintained al levels much higher than otherwise would have occurred. This is the world of mortgage finance we created. The taxpayer is paying the bills.

Today, we are gradually returning to a free market in housing finance, but the government still dominates with well over 90% market share. The federal reserve has stopped buying mortgage-backed securities with printed money, and the government is scaling back it's loan limits. However, when the government took over the GSEs, it assumed the liability for all their bad loans; past, present, and future. The bills keep mounting.

Fannie Mae 1Q loss $8.7 billion

by JON PRIOR — Friday, May 6th, 2011, 3:14 pm

Fannie Mae reported net loss of $8.7 billion in the first quarter, including a $2.2 billion dividend payment to the Treasury Department. The loss narrowed from $13 billion one year ago.

Fannie said still falling home prices drove losses during the quarter. The government-sponsored enterprise estimated home prices fell 1.8% during the quarter, even though some regions experienced gains.

The mortgage giant's regulator the Federal Housing Finance Agency requested $8.5 billion from the Treasury to eliminate Fannie's net worth deficit. Fannie now owes the Treasury $99.7 billion and so far paid $12.4 billion in dividends.

Its sibling company, Freddie Mac actually reported a profit in the first quarter and did not request funds. Together both Fannie and Freddie have pulled a total of $164.4 billion from the Treasury since entering conservatorship in 2008.

Despite the continued losses, Fannie Mae showed how vital its operations are to funding the housing market. It remained the largest issuer of mortgage-backed securities in the first quarter, purchasing or guaranteeing roughly $189 billion in loans. The company's market share dipped to 48.6% in the quarter from 49% in the previous period.

But Fannie said if the market shifts away from refinancing as is likely to occur as mortgage rates rise, market share will dip further.

A declining market share for the GSEs is exactly what we need. Eventually, their market share needs to fall to zero and the entities need to be eliminated. Realistically, that process won't begin in earnest until the housing market achieves a durable bottom, probably in 2012 or 2013.

While business could be declining, legacy issues are too. The serious delinquency rate on Fannie Mae loans dropped to 4.27% in the first quarter from 5.47% one year ago and 4.48% in the previous period. The company said modifications and other workouts, combined with foreclosures when other alternatives are exhausted, outnumbered new delinquent loans hitting its books.

That is a good sign. We can't bring down REO inventories until we stop adding to them. Of course, the vast majority of loan modifications will fail, and those properties will once again go delinquent, but by delaying the inevitable, it allows the GSEs to reverse the tide of delinquencies, but it also ensures the liquidation process will drag on far longer than anyone anticipates.

Fannie Mae CEO Michael Williams said “credit-related expenses” will remain high in 2011 as it remains exposed to falling home prices.

“As we move forward, we are building a strong new book of business that now accounts for 45% of the company’s overall single-family guaranty book of business,” Williams said. “We continue to be the leading provider of liquidity for single-family mortgages and affordable multifamily rental housing while we remain focused on our responsibility to find solutions for distressed homeowners and their families.”

The only solutions the GSEs are providing is to give free houses to delinquent mortgage squatters on the taxpayer's dime.

In other GSE news,,,

Freddie Mac sells record number of REO in 1Q

by JON PRIOR — Friday, May 6th, 2011, 5:36 pm

Freddie Mac sold roughly 31,000 previously foreclosed and repossessed homes in the first quarter, a new record for the company as both government-sponsored enterprises shed inventory from the end of last year.

Combined, both Fannie Mae and Freddie hold 218,000 REO properties as of the end of the first quarter, down from roughly 234,000 at the end of 2010, according to their filings.

In the first quarter of 2011, Freddie holds roughly 65,000, compared to its larger sibling Fannie, which holds 153,000 REO in its inventory.

While both GSEs made progress in cutting down this portion of the nation's inventory of foreclosed homes, which continues to drag down home prices, inventory has elevated since one year ago.

Both Fannie and Freddie held 163,000 properties in the first quarter of 2010, almost what Fannie holds currently by itself.

Repossessions at Freddie increased by nearly 1,000 in the first quarter, and the holding period for these homes averaged 191 days before being resold. This varies significantly from state to state, especially as servicers restart foreclosure processes in different areas of the country. Servicers paused the process late last year to correct procedural problems.

The GSEs are delaying processing many of their delinquent loans because they already have too many REOs, and they are delaying releasing their REOs because if they don't they will pummel house prices.

“We expect the pace of our REO acquisitions to increase in the remainder of 2011, in part due to the resumption of foreclosure activity by servicers, as well as the transition of many seriously delinquent loans to REO,” Freddie said in its financial supplement.

Fannie, Freddie align servicing guidelines for delinquent mortgages

by JON PRIOR — Thursday, April 28th, 2011, 1:31 pm

The Federal Housing Finance Agency directed Fannie Mae and Freddie Mac Thursday to align their guidelines for servicing delinquent mortgages.

Previously, the government-sponsored enterprises maintained different requirements for how their mortgage servicers would treat these loans. But the FHFA forced an alignment to push servicers into engaging the borrower as soon as they become delinquent. The foreclosure process cannot begin if the borrower and servicer are working toward solving the delinquency in a good-faith effort, effectively prohibiting the practice of “dual tracking.”

The state of California blocked legislation that would have prohibited dual track foreclosure. The GSEs are merely adding time to the foreclosure process and enabling delinquent mortgage squatters to further game the system.

Under the new requirements, servicers must engage in a single track for considering foreclosure alternatives up to the 120th day of delinquency, according to the FHFA. Servicers must also perform a formal review of the case to confirm the borrower was considered before starting foreclosure. Even then, servicers are required to continue work with the homeowner on other alternatives.

Not only procedures, but incentives were aligned. Servicers for both GSEs will be rewarded and penalized the same under the new guidelines.

“FHFA's directive to align Enterprise policies for servicing delinquent mortgages should result in earlier servicer engagement to identify the best solution available for homeowners, given their individual circumstances,” said FHFA Acting Director Edward DeMarco.

The FHFA said the updated framework will expedite borrower outreach, align modification terms and establish “a consistent schedule of performance-based incentive payments and penalties.”

Now all the bad processes that encourage strategic default will be uniform. I don't see that as an improvement.

Fannie Mae CEO Michael Williams said the alignment is a major step toward an improved servicer process.

“This initiative will direct servicers to reach families earlier, communicate more frequently and clearly, and provide relief,” Williams said. “Fannie Mae fully supports this Initiative, and we remain committed to stabilizing communities and building a stronger foundation for housing.”

Freddie Mac CEO Ed Haldeman said the FHFA action will simplify the process for delinquent borrowers.

“Alignment of key servicing practices between our two companies will help servicers achieve these goals by enabling them to streamline their operations and more effectively target resources to distressed borrowers,” Haldeman said in a statement. “For example, it will simplify the process for seeking help by giving borrowers one application to fill out and servicers one application to review for all Freddie Mac loan modifications and foreclosure alternatives.”

The GSEs should be dismantled. They can no longer successfully function as a quasi governmental agency. Lenders would prefer to keep the GSEs around so lenders can continue with an origination model with no risk, but with the US taxpayer being on the hook for the foolishness of bankers everywhere, I doubt that model will survive much past the market bottom.

They went Ponzi too

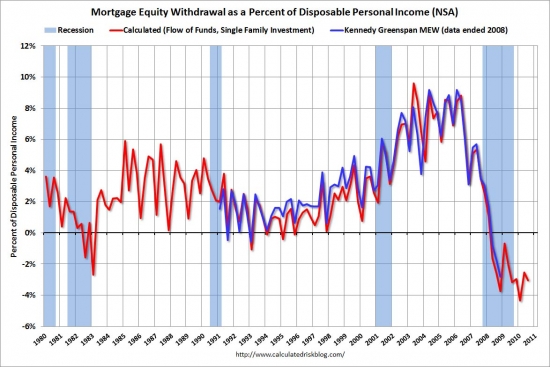
Day after day, I see more loan owners and Ponzis than responsible owners who paid down their mortgage. Eventually, I will run out of these profiles because we haven't created any new ones in the last 4 years. With the credit crunch in August 2007, the mortgage equity withdrawal spigot was abruptly turned off.

Contrary to popular belief, the free money of mortgage equity withdrawal will not be coming back soon. In a rising interest rate environment, money is no longer free. Adding to debt adds to monthly bills. Only the steadily falling interest rates of the Greenspan era allowed refinancing of larger and larger amounts with the same payments. It also permitted borrowers to Ponzi themselves into unsustainable lifestyles which they now have to abandon.

Unfortunately, the general public knows none of this. Most buyers who overpaid for Orange County real estate over the last 4 years did so because they fully expect house prices to go up and lenders to resume handing out free money. Despite the crash, most wouldbe buyers consider California real estate to be a bottomless pit of gold.

Shevy and I have been advising people to look at a house as an expense not an investment. A mortgage is to be paid off, not added to or otherwise “managed.” I harp on this day after day because I keep seeing people who lost their homes because they fell victim to the kool aid thinking in California. These people all had a choice, and they made the wrong one — often multiple times with varying degrees of stupidity. Nothing can be done for these loan owners, but we can all learn something from their mistakes.

  • The owner's of today's featured property paid $377,000 on 12/14/2001. My records are incomplete, but it looks as if they used a $301,600 first mortgage (80% LTV), a $75,000 second mortgage, and a $400 down payment.

These people were very regular about their visits to the housing ATM. In April for four consecutive years, they extracted a little cash — well, actually a lot of cash. Many people become accustomed to an April “windfall” when they get their tax refund. The forced savings of tax withholdings is the only savings many people have. These borrowers must have felt their tax returns were not big enough, so they borrowed themselves into oblivion.

  • On 4/16/2003 they refinanced with a $436,500 first mortgage.
  • On 4/29/2004 they obtained a $420,000 first mortgage and a $78,750 stand-alone second.
  • On 4/7/2005 they opened a $130,525 HELOC.
  • On 4/10/2006 they obtained a stand-alone second for $254,260.
  • Total property debt is $674,260.
  • Total mortgage equity withdrawal is $297,660. Not bad for a $400 investment.

Given that such a windfall has proven possible, it's not surprising that California real estate is so highly prized.

Irvine House Address … 1 SOLANA #22 Irvine, CA 92612

Resale House Price …… $550,000

House Purchase Price … $377,000

House Purchase Date …. 12/14/2001

Net Gain (Loss) ………. $140,000

Percent Change ………. 37.1%

Annual Appreciation … 4.0%

Cost of House Ownership

————————————————-

$550,000 ………. Asking Price

$110,000 ………. 20% Down Conventional

4.62% …………… Mortgage Interest Rate

$440,000 ………. 30-Year Mortgage

$96,896 ………. Income Requirement

$2,261 ………. Monthly Mortgage Payment

$477 ………. Property Tax (@1.04%)

$0 ………. Special Taxes and Levies (Mello Roos)

$115 ………. Homeowners Insurance (@ 0.25%)

$0 ………. Private Mortgage Insurance

$384 ………. Homeowners Association Fees

============================================

$3,236 ………. Monthly Cash Outlays

-$380 ………. Tax Savings (% of Interest and Property Tax)

-$567 ………. Equity Hidden in Payment (Amortization)

$191 ………. Lost Income to Down Payment (net of taxes)

$89 ………. Maintenance and Replacement Reserves

============================================

$2,569 ………. Monthly Cost of Ownership

Cash Acquisition Demands

——————————————————————————

$5,500 ………. Furnishing and Move In @1%

$5,500 ………. Closing Costs @1%

$4,400 ………… Interest Points @1% of Loan

$110,000 ………. Down Payment

============================================

$125,400 ………. Total Cash Costs

$39,300 ………… Emergency Cash Reserves

============================================

$164,700 ………. Total Savings Needed

Property Details for 1 SOLANA #22 Irvine, CA 92612

——————————————————————————

Beds: 3

Baths: 2

Sq. Ft.: 2000

$275/SF

Property Type: Residential, Condominium

Style: Two Level

View: Park/Green Belt

Year Built: 1975

Community: Rancho San Joaquin

County: Orange

MLS#: S657444

Source: SoCalMLS

Status: Active

——————————————————————————

A superb opportunity to acquire this stunning and spacious Two-Story Townhome with Just One Common Wall for a great price. This home boasts an elegant front yard leading to the tastefully upgraded interior. The gourmet kitchen with granite countertops and matching appliances is a delight for every Chef. The crownmolding complements the high quality tile floors and the newer carpet throughout this bright and spacious home. Schedule a showing today to appreciate the charm of this welcoming home in a very desirable neighborhood.