Installment #6 in our series of analyses of the Irvine housing market focuses on rents and the cost of ownership of Irvine condos. The surprising result: it's now less expensive to own condos in Irvine on a payment basis relative to rents than before the housing bubble.
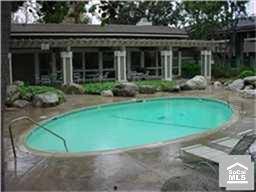
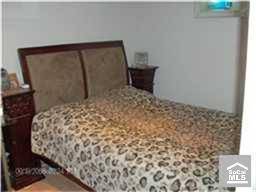
Irvine Home Address … 205 SPRINGVIEW Irvine, CA 92620
Resale Home Price …… $130,000

Let me go home
I've had my run
Baby, I'm done
I gotta go home
Let me go home
It will all be all right
Michael Buble — Home
Home is not an address, it is a state of mind. I felt “at home” growing up. I lived in a small community with my parents and extended family. I had roots which ran deep. My family owned their property, subject to a conventional mortgage which they dutifully paid off. The thought of losing the family home never crossed our minds. My parents never did anything to imperil it.
I bought my first home at 29. I bought a lot and contracted its construction. I overbuilt and over-borrowed, and when I had to move to take a job, I had to sell for a loss. I wrote a check at the closing table. Nobody had heard of a short sale in 2000, and I didn't know it was an option. Foolish me.
I am about to close on a home in Las Vegas. The first of many I plan to buy there. My parents are also closing on two homes, and they plan to buy more as well. My family is going “all in” on a bet on Las Vegas's future.
We are buying because the cashflow in Las Vegas is outstanding. We know prices will likely go down for a while, but that just means deals on future homes will get that much better. The window of opportunity will only be open so long, and we want to buy all that we can while the prices are so low. With 8% to 12% cap rates, the positive cashflow will help us ignore the declining resale values for a couple of years. We will have no pressures to sell since we are making money as we hold the property.
Positive cashflow is a significant motivator. The desire to obtain it motivates buyers who will ultimately form the bottom of the housing market. Kool aid intoxication and the belief in the magic appreciation fairy doesn't motivate enough buyers in a declining market to cause a bottom to form. The reason the 2009 rally failed was because prices were still too elevated to make properties cashflow positive.
Two years later prices are lower, and interest rates are lower still. Many properties in many neighborhoods even here in Irvine are trading at or below rental parity. Those are the conditions which prompt people to buy. When enough people are motivated by savings over renting, the owner-occupant herd will move in to stabilize prices. If there aren't enough owner occupants, as there aren't in Las Vegas, then prices fall further until cashflow investors ultimately mop up the mess.
Over the last several weeks, the IHB has been proud to present a series of hedonic house price analyses by Jaysen Gillespie of Global Decision:
An accurate view of the Irvine housing market by Global Decision and IHB
A detailed look at Irvine Village premiums by Global Decision and IHB
The market value of Irvine home features by Global Decision and IHB,
OC Housewife, Ponzi borrower, failed land baron, and
Irvine condo and SFR price trends by Global Decision and IHB
Today's topic is the comparison of the cost of renting versus owning. It's all about cashflow and how it impacts people's decisions.
A presentation by Jaysen Gillespie of Global Decision
info@globaldecision.com
Global Decision is an analytics consulting firm. While our methods are not industry-specific, our engagements are skewed towards specific industries in Southern California, such as real estate (along with online gaming and restaurant chains). We specialize in applying both foundational and advanced analytics to better understand business and economic issues.

Today continues our series on using the Global Decision Hedonic Price Model to determine how homes values are trending and the underlying factors that create such value. For this week’s analysis, we’ve created a hedonic price model for lease rates for Irvine condos. By looking at how the relationship between the cost-to-rent and the cost-to-own, we can derive additional insight into the behavior of the local housing market.
The above chart shows the home value index (2000 Q1 = 100) for Irvine, CA condos, along with an index representing the cost-to-rent for Irvine, CA condos. As our previous post showed, the prices of Irvine condos soared to a bubble peak of approximately 2.5 times the reference prices in Q1 2000. Prices have declined substantially since then, with an average Irvine condo losing about 30% in value over the last 4-5 years.
The Irvine condo home value results are not unique to Irvine and are, in fact, quite representative of the Southern California top-tier housing market as a whole. The thin black line represents the Case-Shiller LAOC High Tier home value index, and it follows a similar price trend.
The blue line, by contrast, is completely different. This line represents the cost to rent, using a hedonic approach to control for the usual factors that influence the rental value (square footage, neighborhood, beds, baths, garage, etc.). The next chart looks at the cost-to-rent line in more detail:

Interestingly, Irvine suffered a mini-bubble in rents, probably driven by falling incomes and rising unemployment. The long-run trend in Irvine rents exhibits a fairly reasonable increase of 2.5%/year (based on the 11-Year CAGR in the rent index). It appears that the Irvine rents are now back “on trend.” A rent bubble is much more likely to deflate quickly: there are no delayed foreclosures, and owners will quickly adjust rental rates to market price to avoid an immediate loss of rental income.
Market rent is not as directly impacted by interest rates. Of course, one might argue that mortgage interest rates affect the demand for owned vs. rental housing, and those shifts in demand may factor into the market rent that a landlord can demand. However, the impact of interest rates is not nearly as significant in the rental market. For this reason, the rental index is a better measure of the true economic value of owning a property.
In one school of thought, the value of any asset is determined by the stream of rental income that asset could produce. This is a very logical way to look at the purchase of a home: by buying a home the real “savings” is the offset to the rent you would have to pay to occupy a similar structure over time. A home is a higher-risk financial proposition in the short term (see our primer on “What Is Risk?” to understand why), and the ownership costs should reflect the risk profile and illiquidity associated with ownership. For this reason, we expect ownership costs to be below rental costs as our “base case.” Deviations from the base case will occur when the market perceives non-financial benefits to ownership and/or when it’s hard to rent a comparable asset. These deviations appear most often in better neighborhoods – and the IHB has cited this phenomenon when quoting how a GRM (gross rent multiple) is often higher in higher-end areas.

The above chart shows the prevailing 30 Year fixed rate mortgage rate for the last 11 years, courtesy of HSH and available for download at http://www.hsh.com/mtghst.html, along with a Global Decision index called the “Own-Monthly-Index.” We’ve estimated the cost-to-own based on both the property purchase price and the prevailing mortgage rate. This estimate is shown as the purple line above. By looking at all four lines, we can develop a four-phase story of the Irvine, CA housing bubble:
Phase 1: 2000-2004. Home prices rose sharply, but new buyers were willing (and able) to finance higher cost properties due to falling interest rates. Monthly ownership costs did not rise appreciably for well-qualified buyers. Loan standards generally allowed “well-qualified” to be defined by (i) DNA at least 98% Homo Sapien and (ii) resting heart rate >= 30 bpm. Ability to fog a mirror considered strong plus.
Phase 2: 2005-2007. Home prices rose sharply, but interest rates remained flat. Buyers incurred much higher monthly carrying costs. The buyer pool was expanded via subprime lending and other non-standard financing arrangements until it reached exhaustion.
Phase 3: 2008-2011. Home prices deflated quickly, falling 30% in 4 years. Rents saw a mini-bubble of their own deflate. 2011 rents remain well below their 2007 peak values.
Phase 4: 2011-Onwards. Interest rates have declined to the point where more-and-more properties have valuations that are supported by monthly costs below rental parity. The tradeoffs between a low monthly ownership cost and the desire to avoid risking capital (down payment), along with the future direction of interest rates (up or down – see Japan 1990-2005) will determine how and where home values find an equilibrium.

The above graph shows the ratio of the property price index to the rent price index, along with the ratio of the monthly payment index to the rent index. The property price ratio to rent remains elevated. However, the payment-lowering impact of 4-5% interest rates has created a situation where the monthly payment index has returned to pre-bubble levels.

Another way to look at the last 11-years of the Irvine housing market is to take two snapshots, each relative to 2000-Q1. The first snapshot is taken at peak-pricing. The bubble “warning signs” were loud and clear (which is easy to say in retrospect!). The cost-to-rent had been growing at 4.9%/year, but purchase prices had been growing at 16.5%/year. For those numbers to pencil, the cost-of-money would have to be declining at a rate that makes up the difference (about 11%/year). Because the cost-of-money decline was only 3.7%/year in that timeframe, the “gap” forms the basis for calling the market a speculative bubble.
In the second snapshot, we find a much more reasonable set of figures. Rents have risen 2.5%/year, and home values have risk at 5.6%/year. However, because the cost-of-money has declined at 4.7%/year, a payment-oriented buyer in 2011-Q1 is no worse off (and potentially better off) in 2011-Q1 than in 2000-Q1. The primary negative to the payment-oriented buyer philosophy is that he or she must carefully consider how the property valuation may change if interest rates are higher in the future.
Conclusions
There are essentially two differing conclusions you could choose to draw from each of the above two charts:
1. The ratio of home sales prices to rents remains elevated and will continue to deflate until pre-bubble levels are restored. The values of homes will continue to decline, unless rents increase significantly. Waiting to purchase a home is a wise decision.
2. The ratio of monthly payments to rents is actually now below 2000-Q1 levels. The impact of low interest rates is now so significant that buyers will be drawn into the market. Buying a low payment will trump worries about declines in the value of the underlying asset. Purchasing a home now is a wise decision.
IrvineRenter's Commentary
The dilemma Jaysen describes above is the core problem with our housing market. There is only one reasonable way to cope with it, and it's the advice we have been giving buyers for the last three years:
Only buy a home if the payment is less than comparable rents and you plan to stay for at least three to five years.
Saving money versus renting is a legitimate reason to buy even in a declining market, but you will have to wait until resale prices rebound before you can sell. That will likely take some time. The further up the housing ladder you look, it's less likely you will find a property selling below rental parity, and it's more likely the property will decline further in value.
Most people given these circumstances will wait — at least the ones who have accurate information about what's happening in the market (that excludes most who believe realtor advice). IMO, this fall and winter will probably be a good time to buy. Next fall and winter will be even better. The fall and winter of 2013/2014… your guess is as good as mine. The window of opportunity is opening. Seize it at your leisure.
What happens when interest rates go up?
The other key point you should take away from Jaysen's analysis is the key role falling interest rates play in affordability calculations. The cost of borrowing money declined by nearly 4% a year for the entire last decade. What happens when the cost of borrowing goes up 4% a year for a decade? It's difficult to imagine that will have a positive impact on pricing.

Prices went up during the 1970s while interest rates rose because wage inflation was high, and lenders allowed debt-to-income ratios to exceed 60% in anticipation of more wage inflation. This was the Ponzi virus Paul Volcker stamped out by raising interest rates to 20%. Do you think it likely that we will see high wage inflation with our current persistent unemployment problem? I don't.

The implication is that prices may be held in check by rising interest rates for a very long time. This may immobilize anyone who buyer today for longer than three to five years. Eventually, amortization on the loan will create enough equity to pay a sales commission to leave, but giving hard-earned money to a realtor is less fun than the magic appreciation fairies bestowing you will hundreds of thousands of dollars. Beware.
A 100% financing holdout
Back in 2007 and 2008, I profiled many properties where the owners put nothing down and walked when prices didn't go up. It's been much more rare to see an owner like the one who owns the loans on today's featured property. He kept making his onerous payments on a property worth about half of what he paid for it. He's a dutiful borrower that undoubtedly pleased the lender. Unfortunately for the lender, he wants out, and he isn't willing to wait the 15 years or more it will take for condo prices to come back.
This property is undeniably cheap to own. Even an FHA buyer will only spend $1,000 a month to live here. At this price, it may even be a decent cashflow investment.
——————————————————————————————————————————————-
This property is available for sale via the MLS.
Please contact Shevy Akason, #01836707
949.769.1599
sales@idealhomebrokers.com


Irvine House Address … 205 SPRINGVIEW Irvine, CA 92620
Resale House Price …… $130,000
Beds: 1
Baths: 1
Sq. Ft.: 475
$274/SF
Property Type: Residential, Condominium
Style: One Level, Other
View: Creek/Stream
Year Built: 1977
Community: Northwood
County: Orange
MLS#: S651639
Source: SoCalMLS
On Redfin: 150 days
——————————————————————————
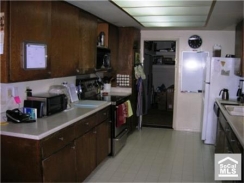
Short Sale Approved at 130,000 * * * * * Resort Living * * * * * completely remodeled. Great lower level unit in a great neighborhood ! Several tennis courts, two pools, and a balcony with a view of the streams. Large enclosed patio area, easy parking with easy access to front door. In a beautiful complex with lots of trees. Unit is conveniently close to laundry room and main pool. Must see !
——————————————————————————————————————————————-
Proprietary IHB commentary and analysis ![]()
Resale Home Price …… $130,000
House Purchase Price … $255,000
House Purchase Date …. 1/9/2006
Net Gain (Loss) ………. ($132,800)
Percent Change ………. -52.1%
Annual Appreciation … -11.5%
Cost of Home Ownership
————————————————-
$130,000 ………. Asking Price
$4,550 ………. 3.5% Down FHA Financing
4.19% …………… Mortgage Interest Rate
$125,450 ………. 30-Year Mortgage
$44,004 ………. Income Requirement
$613 ………. Monthly Mortgage Payment
$113 ………. Property Tax (@1.04%)
$0 ………. Special Taxes and Levies (Mello Roos)
$27 ………. Homeowners Insurance (@ 0.25%)
$144 ………. Private Mortgage Insurance
$240 ………. Homeowners Association Fees
============================================
$1,137 ………. Monthly Cash Outlays
$0 ………. Tax Savings (% of Interest and Property Tax)
-$175 ………. Equity Hidden in Payment (Amortization)
$7 ………. Lost Income to Down Payment (net of taxes)
$36 ………. Maintenance and Replacement Reserves
============================================
$1,005 ………. Monthly Cost of Ownership
Cash Acquisition Demands
——————————————————————————
$1,300 ………. Furnishing and Move In @1%
$1,300 ………. Closing Costs @1%
$1,254 ………… Interest Points @1% of Loan
$4,550 ………. Down Payment
============================================
$8,404 ………. Total Cash Costs
$15,400 ………… Emergency Cash Reserves
============================================
$23,804 ………. Total Savings Needed
——————————————————————————————————————————————————-
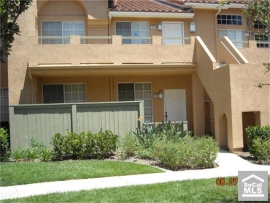





 Notice how the sentence above starts with spin to put a good face on the really bad news that follows.


.jpg)






.jpg)


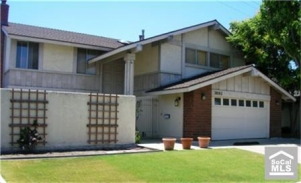
 * * * REDUCED * * * JUST REMODELED AND UPDATED MONTICELLO 3/3 UNIT IN THE VILLAGE OF NORTHPARK SQUARE. REGULAR SALE!! NO WAITING!!! MOTIVATED SELLER!! GREAT LOCATION. .. NO ONE ABOVE OR BELOW. HAS A ONE BEDROOM AND FULL BATHROOM ON THE MAIN FLOOR. MAIN BATHROOM JUST UPDATED WITH NEW LIGHTS, NEW BRONZE FAUCETS, AND NEW MIRRORS. OPEN AND SPACIOUS KITCHEN WITH CENTER ISLAND, BREAKFAST COUNTER, ALL WITH NEW GRANITE COUNTER TOP, NEW BRONZE FAUCETS, AND ALL NEW STAINLESS APPLIANCES. MASTER BEDROOM BOASTS A SPACIOUS WALK-IN CLOSET AND OVERSIZED SOAKING TUB WITH A SEPARATE SHOWER UNIT, WITH ALL NEW LIGHTS AND BRONZE FAUCETS. FIREPLACE IN THE LIVINGROOM. NEW HARDWOOD/LAMINATE FLOORING. CROWN MOLDING. NEW ELECTRICAL LIGHT FIXTURES. NEW DESIGNER PAINT. 2-CAR ATTACHED GARAGE WITH DRIVEWAY AND DIRECT ACCESS. WALKING DISTANCE TO BECKMAN HIGH. COMMUNITY AMENITIES INCLUDE THREE PARKS, JUNIOR OLYMPIC POOL, BBQ AND PINIC AREAS, BASKETBALL COURT, TOT LOT. .. .