Tonight I will be giving a presentation on the Orange County housing market. Today's post examines why this data is important and how to use it.
.png)


Irvine Home Address … 166 West YALE Loop Irvine, CA 92604
Resale Home Price …… $464,900

We been together for a few years
Shared a few tears
Called each other nicknames
Like Sugar Plum and Poo BearLike IrvineRenter and Zovall
I know you aggravated
Walk around frustrated
Ya patience gettin' short
How long can you tolerate it
Listen ma I'm just motivated
I do this for us
Step on the grind
tryin' to elevate it now
Busta Rhymes — I Know What You Want
There are too many market indicators. Anyone who has studied technical analysis of stocks quickly realizes there are far too many ways of parsing data, and most of them are useless. As I pondered what I wanted to present to give an overview of the housing market, I considered many ways of looking at the data. I rejected many of the indicators I felt were irrelevant to answer the basic questions buyers have.
What do buyers want to know?
Most buyers want to know two things: (1) am I paying too much, and (2) are prices likely to go up or down in the future. These are important questions. People asked these same questions in 2006 and came up with the wrong answers. The people who answered these questions incorrectly in 2006 have either been wiped out financially, or they are trapped underwater in their homes for the foreseeable future.
Answering these questions accurately is important to any buyer's financial future. It's worth the time and effort to obtain the right answer.
We all know realtors don't have the answers. No matter the time or the circumstances, realtors will always tell you it is a good time to buy or sell. realtors are not concerned with accuracy, only commissions. Don't listen to them.

In all my writings for this blog, I have used accurate market data and formed an impartial opinion about both value and the direction of prices based on my analysis of that data. If the data says prices are too high and they should fall, I say so. If the data says prices are too low and they should rise, I say that too. Many try to stereotype me as a perma-bear because I have been bearish for so long. I'm not a perma-bear. The data has suggested prices are too high and they should fall for nearly 5 years now. When the data changes, so will my opinion — as it already has in Las Vegas.
Rental parity is a measure of value
To answer the first question, “am I paying too much,” I pioneered the rental parity analysis technique I briefly described in Using rental parity to find bargain properties. Rental parity is the best measure of value because it compares the cost of ownership to the cost of rental. This makes sense because either method will enable people to obtain the beneficial use of real estate. Patrick.net has a great rental parity calculator you can use to analyze any property. Check it out.
Rental parity by itself is not enough. Rental parity is not an absolute. Some neighborhoods always trade below rental parity, and some always trade above it. The neighborhoods that trade below rental parity are undesirable. Prices need to be below rental parity to attract owners to want to live there. The neighborhoods that trade above rental parity are very desirable. Buyers will typically take their accumulated equity from previous sales and bid prices above rental parity buy utilizing large down payments.
Even before the housing bubble and subsequent crash distorted the down payment figures, the beach communities had the highest down payments, and the less desirable inland communities had the smallest. Irvine was somewhere in between.

Rental parity will accurately describe the degree of price inflation in the market.

To evaluate individual neighborhoods by city or zip code, the current measure of rental parity must also be considered relative to its historic norms. Basically, beach communities are always inflated, but how inflated are they normally, and how does current pricing compare? Those are the key questions of value.
If a neighborhood or property is trading at or below its historic relationship to rental parity, it is a bargain. If above, it is inflated.
I have been writing for over 4 1/2 years now, and I have consistently made the point that values were inflated. Times have changed. Many neighborhoods are still inflated, but several are not. Further, the degree of price inflation is much smaller than it used to be. With falling prices and historically low interest rates, Irvine is now at rental partiy for a buyer putting 20% down using a 30-year fixed rate mortgage.

Bullishness in a declining market
Many people have asked me how I can be bullish on markets like Las Vegas where prices are still declining. The question reveals an underlying bias toward appreciation I don't agree with. Valuation alone is reason to be bullish.
I am bullish on Las Vegas because properties there represent a great value. The cost of ownership relative to rent is very low. Since my holding time is much longer than it will take to cycle past the bottom, I want to buy while there is still plenty of available inventory and time for me to complete a large number of purchases.
If I attempted to time the bottom tick of the market in Las Vegas, I would undoubtedly miss it. Then I would be competing with more aggressive buyers in a market with depleted supply. By the time I acquired all the properties I wanted, prices would likely be much higher than they are today. Buying at the tail end of a declining market is actually the best time.
Orange County is not Las Vegas
My bullishness in Las Vegas does not directly translate to bullishness in Orange County. We are certainly closer to the bottom than to the top, but the valuations are not good — certainly not so good they would motivate a value buyer to act — and since lenders have not capitulated here, Orange County's housing market will likely bottom later than Las Vegas's. Las Vegas will be the textbook example of capitulation and recovery whereas Orange County will be the classic example of the slow deflation most like Japan's housing market from 1990-2005.
My views on Orange County have migrated from “don't buy” to “buy if you are paying below rental parity and you have a long holding time.” Basically, anyone buying today will have to wait out the bottom. It will likely be three to five years (or more) before prices rise enough to give today's buyers enough equity to sell and pay a broker without losing money.
I guess you could say I am bullish with qualifications.

Measures of price direction and momentum
The other question buyers want to know concerns the direction of prices. As I have stated on many occasions in many posts, I believe prices will decline further before reaching the bottom. In aggregate over the entire Orange County market, that is likely what will happen. However, when you start to localize the data, the price crash has proceeded at different rates in different areas. Only through a more detailed analysis will the truth of market price direction and momentum be revealed.
Some market indicators seek to measure supply and demand and the balance between them. These indicators are as follows:
- Inventory for sale (supply)
- Total sales (demand)
- months of supply (balance)
The months of supply is a useful indicator. To be accurate it be calculated based on total closed sales. One local realtor publishes a widely read and completely inaccurate months of supply based on pending sales. The effect of using pending sales instead of actual closings is to make the months of supply a smaller number. Since months of supply has a commonly accepted interpretation — over 6 months is bad and under 6 months is good — using pending sales always makes the months of supply look better than it really is.
This kind of manipulation of data is at the core of why realtors can't be trusted. I believe the use of pending sales to make the numbers look better is intended to create a false sense of urgency in buyers by convincing them the supply and demand balance is tighter than it really is. Why else would someone use the wrong data, particularly when the right data is easily obtainable?
If the data is accurate, the months of supply provides a short-term gauge of the direction of prices. When the figure is over 6 months, prices generally either flatten or go down over the next 90 days. When the figure is less than 6 months, prices may go up — assuming buyers are motivated and have ready access to financing.
Other market indicators measure price momentum such as:
- Median home price and year-over-year change
- Average resale $/SF and year-over-year change
- Average rental $/SF and year-over-year change
Whenever realtors want to make a bad report look good, they will focus on the month-to-month change in prices, particularly during the spring when this nearly always rises. Housing markets nearly always exhibit a strong seasonal pattern of spring rallies and fall declines. The only way to get an accurate handle on price momentum is to look at the year-over-year change.
At the time of this writing in September of 2011, the market has gone up for the last three or four months on a month-to-month basis. However, on a year-over-year basis, the market is down. The month-to-month increase reflects the seasonal pattern while the year-over-year decline reflects the macro trend in the market. Month-to-month fluctuations only become noteworthy when they move against the seasonal pattern as they did this spring when they declined during a period when prices generally rise.
Of the three indicators of momentum above, the average rental $/SF year-over-year change is the most revealing. As we have seen, resale prices are quite volatile and reflect the irrational exuberance of buyers and the collective foolishness of lenders. However, rental rates closely track wages and the underlying employment picture which ultimately drives resale demand. For this reason, I favor rental $/Sf as the best leading indicator for the direction of house prices.
Monthly presentations and IHB posts
Back in March, I wrote the post The future of IHB news and real estate analysis. In it I spelled out my vision for continuing with the IHB:
Data is important, isn't it?
It's a shame the NAr has gone down the path it has. Few reliable sources of real estate analysis and information exist, and few signs the NAr is going to become one of them. That leaves a void. Uncharted waters buyers must navigate without a reliable guide. It's a void we seek to fill here at the IHB.
We are in the process of assembling our own private database of housing and related economic statistics. Over the next several weeks as I have time to digest the new information, I plan on a number of new analysis posts to truly illuminate the activity in our local housing market.
I have no agenda to spin the data. Let's see what is really going on. I want to be accurate. People can make their own decisions and draw their own conclusions from accurate data. If approached without the built-in bias of a realtor, data analysis can be revealing rather than deceiving.
I will still have a dog in this hunt. I do run a business that makes money from real estate transactions. I am subject to the same biases as any other human being. I sell real estate, but I am not a realtor. The truth needs no salesman. I will present data as accurately as I can. If reality motivates you to buy or rent, the IHB can help you. I have no desire to manipulate data in order to make a quick buck. This is a part-time hobby for me, not my livelihood.
I have assembled enough data to begin more frequent posts and monthly presentations to provide my take on the local housing market. The IHB is poised to enter the next era.
Writing the IHB has been great fun for me over the last 4 1/2 years. I have turned my enjoyable hobby into a source of supplemental income without draining the joy out of the activity. However, there comes a time when I ask myself if it's worth all the work. Am I really providing any value?
Telling people not to by and saving them from ruin was worth the work so far, but without the urgency to save the masses, I need another reason to keep going. If I'm not adding any value, I will just fade away.
Now that I am surrounded by a great team, I feel I am part of a new way of delivering real estate services. We believe buyers and sellers need accurate information to make informed decisions. Our clients approach the transaction with appropriate expectations, and client satisfaction is high because of it. We're not perfect, and we make mistakes, but we offer our honest opinions and advice and do our best to serve.
Presentations tonight
I hope to see you tonight at JT Schmids at the District. I will be there by 5:00 for happy hour. The OC housing market presentation is at 6:00 and the cashflow investment presentation is at 8:00. I hope to see you there.


An “Extremely well priced home”
The agent believes this property is “extremely well priced.” It is a short sale teaser price to be sure, but it is priced to what I believed bottoming values would look like back when I pondered the crash back in 2006-2007. Of course, the numerous government interventions and super low interest rates have prevented prices from reaching reasonable levels, but those low interest rates have also made higher prices more palatable.
Today's featured property is priced at $242/SF in a neighborhood with no Mello Roos. For a conventional buyer putting 20% down, the cost of ownership is under $2,200 per month. If anyone can find a 1,900 SF 3/2 renting for $2,200, let me know because I would take it. This is a typical median-income kind of property asking below rental parity.
Is it just a teaser? Will a bank allow it to sell for this price? Will others bid it up to a higher number? Only time will tell. The effectiveness of the teaser listing is wearing off, and lately, I have seen many properties where low listing prices have been moving even lower. If lenders start releasing these properties rather than holding them in limbo indefinitely, prices will fall to where prices like this are taken for granted.
——————————————————————————————————————————————-
This property is available for sale via the MLS.
Please contact Shevy Akason, #01836707
949.769.1599
sales@idealhomebrokers.com


Irvine House Address … 166 West YALE Loop Irvine, CA 92604
Resale House Price …… $464,900
Beds: 3
Baths: 2
Sq. Ft.: 1900
$245/SF
Property Type: Residential, Condominium
Style: Two Level, Other
Year Built: 1977
Community: Woodbridge
County: Orange
MLS#: S672608
Source: SoCalMLS
Status: Active
On Redfin: 3 days
——————————————————————————
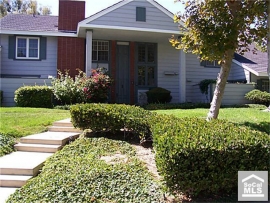
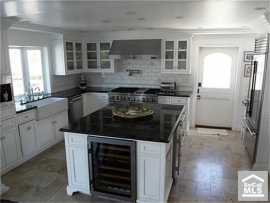
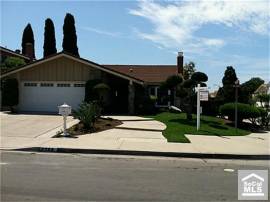
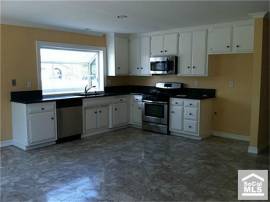
Extremely well priced home in the highly desired Woodbride area of Irvine. This is a townhome that lives like a SFR with 3 bedrooms and 1900 sqft. Homeowners have done some upgrades but house does need some TLC to show at its very best. Popcorn ceilings removed, pergo flooring, some crown moulding, fireplace in Living room and family room, tile in entry area, updated kitchen with granite counters, nice enclosed yard, master bath with jacuzzi. Needs paint and possible update carpet. Walk to the lake and to the local schools. Close to shopping and easy transportation access.
——————————————————————————————————————————————-
Proprietary IHB commentary and analysis ![]()
Resale Home Price …… $464,900
House Purchase Price … $635,000
House Purchase Date …. 6/9/2004
Net Gain (Loss) ………. ($197,994)
Percent Change ………. -31.2%
Annual Appreciation … -4.3%
Cost of Home Ownership
————————————————-
$464,900 ………. Asking Price
$92,980 ………. 20% Down Conventional
4.20% …………… Mortgage Interest Rate
$371,920 ………. 30-Year Mortgage
$105,310 ………. Income Requirement
$1,819 ………. Monthly Mortgage Payment
$403 ………. Property Tax (@1.04%)
$0 ………. Special Taxes and Levies (Mello Roos)
$97 ………. Homeowners Insurance (@ 0.25%)
$0 ………. Private Mortgage Insurance
$402 ………. Homeowners Association Fees
============================================
$2,721 ………. Monthly Cash Outlays
-$298 ………. Tax Savings (% of Interest and Property Tax)
-$517 ………. Equity Hidden in Payment (Amortization)
$139 ………. Lost Income to Down Payment (net of taxes)
$78 ………. Maintenance and Replacement Reserves
============================================
$2,123 ………. Monthly Cost of Ownership
Cash Acquisition Demands
——————————————————————————
$4,649 ………. Furnishing and Move In @1%
$4,649 ………. Closing Costs @1%
$3,719 ………… Interest Points @1% of Loan
$92,980 ………. Down Payment
============================================
$105,997 ………. Total Cash Costs
$32,500 ………… Emergency Cash Reserves
============================================
$138,497 ………. Total Savings Needed
——————————————————————————————————————————————————-


 Wrong! The only reason these markets look healthier is because the foreclosures and resulting REO have not been processed here. Coastal California is the king of shadow inventory. A study by Foreclosure Radar has demonstrated that squatting time increases as loan balance increases. Since coastal California has the largest number of large loans, lenders are simply not foreclosing here in hopes a market rebound will magically produce enough buyers to absorb the inventory waiting in the shadows. It won't work out that way.


