More than 20% of OC loan owners owe more on their mortgage than they could obtain from a sale. With declining prices, this percentage is expected to grow. Foreclosure is the only savior.
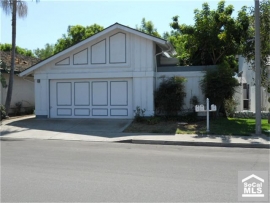
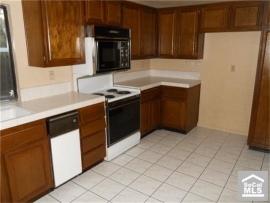
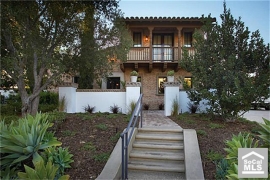
Irvine Home Address … 31 CASTILLO Irvine, CA 92620
Resale Home Price …… $460,000

Well, if you told me you were drowning
I would not lend a hand
I've seen your face before my friend
But I don't know if you know who I am
Well, I was there and I saw what you did
I saw it with my own two eyes
So you can wipe off the grin,
I know where you've been
It's all been a pack of lies
Phil Collins — In The Air Tonight
Many loan owners in OC have no equity. No equity means no real ownership. They own a loan. They are still on title, and most still feel like homeowners, but they have no more financial interest in the property than a renter does, and if they stop paying the rent on the money they borrowed, they will (eventually) get evicted just like a renter.
Some who are underwater are victims of poor timing. Many of these people qualify for loan modifications, and they have been helped. Many more are victims of their own poor choices. They HELOCed themselves into an underwater situation, and the government is not throwing them a debt preserver.
1-in-6 O.C. borrowers still ‘under water’
September 15th, 2011, 12:04 am — posted by Jeff Collins 
Real estate data giant CoreLogic reported that 17.3% of Orange County homeowners with a mortgage still owed more than their property was worth at the end of the second quarter.
In all, 96,747 Orange County homes were “under water” last spring.
Most of these numbers are poor estimates. Zillow for instance only calculates underwater based on the original first mortgage and does not include seconds, refinances or HELOCs. Obviously, that understates the problem. CoreLogic may have better methodology, but the 17.3% seems suspiciously low to me.
While the number of underwater homeowners has dropped steadily over the past 18 months, it’s likely that some of that drop is due to lenders foreclosing on a portion of those properties, taking them out of the mix.
Since properties have declined more than 10% in value over the last year, many more have submerged beneath the waves. Amortization may have helped a few, but foreclosure is how most of the underwater have been relieved of their burdens.
The figures show also that five years after home prices hit their peak and began to fall, large numbers of borrowers still are under water.
The CoreLogic figures show also:
- The number of underwater homeowners fell 5.2% over the past year, a decline of 0.8 of a percentage point. There were 102,000 “negative equity” homes in O.C. at the end of Q2 2010.
0.8%? Less than a 1% drop is not exactly making major progress. At that rate, loan owners will be underwater for about 120 years.
- 4.2% of O.C. homeowners with a mortgage are above water but have debt representing 95% or more of their home’s value.
- More than 23,300 homeowners are just barely above water because they owe 95% or more of their home’s value.
When the dubious 17.3% number who are underwater is added to the 4.2% who couldn't pay a realtor commission to get out, and 21.5% of loan owners are effectively underwater and unable to sell. With 21.5% unable to sell without bank permission, and with no buyers in the last 10 years having any move-up equity, it shouldn't be a big surprise that the move-up market is dead and sales volumes are more than 25% below historic norms.
Orange County has about 120,000 underwater borrowers by CoreLogic's measure, but what about the rest of the country?
Mortgage Delinquencies Drop
By Kevin Chiu — Published September 23, 2011
The number of homeowners behind on their mortgages has dropped as a result of a higher number of mortgage modifications, according to one of the nation’s largest providers of mortgage data. The drop in mortgage delinquencies is a positive sign for the housing market, despite an uphill battle banks and mortgage companies are waging with the foreclosure crisis.
Mortgage delinquencies fell 2.5% in August from July, according to Lender Processing Services, which gathers its data from nearly 40 million mortgages it tracks for the U.S. lending industry. Total delinquencies, which include loans that are 30 days or more past due, dropped to 8.13% last month.
Still, however, the number of single family homes 90 days or more delinquent are near record highs with 1,866,000 late but not in the foreclosure pipeline. Another 4.25-million homes are 30 days or more past due on their mortgages, but not in foreclosure. About 6.4-million homes are 30 days or more delinquent or in the foreclosure process.
6.4 million homes are 30 days or more delinquent or in the foreclosure process. That is an astonishingly high number. And it's expected to get worse as there are 10 million more mortgage delinquencies to come.
The drop in delinquencies, however, is not a clear indication that foreclosures are easing nor are they expected to slow by real estate analysts over the next few years. Aggressive action by government leaders combined with bankers are the only avenues that could aid the housing market as high unemployment and other financial worries trouble the nation’s economy forcing more mortgage holders from their homes, and at risk of foreclosure.
Forcing more mortgage holders from their homes? He means to say that more loan owners will be relieved of their debt burdens on properties they have no ownership in. The language we use to convey information has hidden assumptions and meanings. The people who go through foreclosure are being forcibly removed from properties they no longer own. Many of them had no equity in the property, or they would have sold it prior to the foreclosure. Nobody sheds a tear when a renter gets evicted, but government is supposed to do everything in its power to stop a loan owner from facing the same fate. I think that's bullshit.

Losing HELOC income: when the house in unemployed
During the rally of the housing bubble, houses were like a third wage earner in the family. In fact, for nearly five years in Irvine, the median home price went up by an amount equal to the median income. With access to this windfall through HELOCs, every home owner had another source of income, and best of all, this income was not taxed.
The former owners of todays featured property bought back in 1993. By April of 2006, they ran up a $487,000 mortgage. This was easily double what they paid. But the house was not done working for them. They stopped paying in early 2008, and they were allowed to squat for 3 full years.
Foreclosure Record
Recording Date: 03/25/2010
Document Type: Notice of Sale
Foreclosure Record
Recording Date: 12/24/2009
Document Type: Notice of Default
Foreclosure Record
Recording Date: 03/04/2009
Document Type: Notice of Rescission
Foreclosure Record
Recording Date: 12/01/2008
Document Type: Notice of Sale
Foreclosure Record
Recording Date: 08/22/2008
Document Type: Notice of Default
Irvine real estate is wonderful, isn't it?
——————————————————————————————————————————————-
This property is available for sale via the MLS.
Please contact Shevy Akason, #01836707
949.769.1599
sales@idealhomebrokers.com


Irvine House Address … 31 CASTILLO Irvine, CA 92620
Resale House Price …… $460,000

Beds: 3
Baths: 2
Sq. Ft.: 1337
$344/SF
Property Type: Residential, Single Family
Style: One Level, Contemporary
Year Built: 1977
Community: Northwood
County: Orange
MLS#: S674172
Source: SoCalMLS
Status: Active
On Redfin: 3 days
———————————————————————
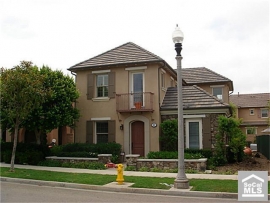
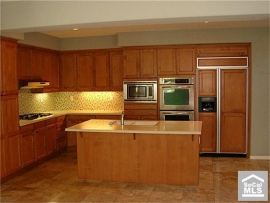
This REO property is located in the highly desired area of Irvine, Northwood. Close to the 'Blue Ribbon' high school, Northwood High, shopping and hiking trails. No Mello Roos and low HOA which includes a tennis court. Walking distance to shopping and parks. This single story home has an open floor plan with vaulted ceilings in the living/ dining area. A side entry for privacy. A real brick wood burning fireplace for your family to gather around on those cold winter nights. With a little work this could be the home of your dreams.
——————————————————————————————————————————————-
Proprietary IHB commentary and analysis ![]()
Resale Home Price …… $460,000
House Purchase Price … $200,000
House Purchase Date …. 8/5/1993
Net Gain (Loss) ………. $232,400
Percent Change ………. 116.2%
Annual Appreciation … 4.5%
Cost of Home Ownership
————————————————-
$460,000 ………. Asking Price
$16,100 ………. 3.5% Down FHA Financing
4.10% …………… Mortgage Interest Rate
$443,900 ………. 30-Year Mortgage
$124,254 ………. Income Requirement
$2,145 ………. Monthly Mortgage Payment
$399 ………. Property Tax (@1.04%)
$0 ………. Special Taxes and Levies (Mello Roos)
$96 ………. Homeowners Insurance (@ 0.25%)
$510 ………. Private Mortgage Insurance
$60 ………. Homeowners Association Fees
============================================
$3,210 ………. Monthly Cash Outlays
.jpg)
-$335 ………. Tax Savings (% of Interest and Property Tax)
-$628 ………. Equity Hidden in Payment (Amortization)
$23 ………. Lost Income to Down Payment (net of taxes)
$78 ………. Maintenance and Replacement Reserves
============================================
$2,347 ………. Monthly Cost of Ownership
Cash Acquisition Demands
——————————————————————————
$4,600 ………. Furnishing and Move In @1%
$4,600 ………. Closing Costs @1%
$4,439 ………… Interest Points @1% of Loan
$16,100 ………. Down Payment
============================================
$29,739 ………. Total Cash Costs
$35,900 ………… Emergency Cash Reserves
============================================
$65,639 ………. Total Savings Needed
——————————————————————————————————————————————————-


 Housing woes are still the primary cause of our weak economy. An entire industry is sitting on the sidelines.


 The housing bust in California has enabled many renters to buy properties closer in to employment centers. The commute through the valley on the 91 is no longer a necessary price to pay to have a nice house for many who work in Orange County.






 It's difficult for most industry veterans to understand how low prices and low interest rates aren't creating demand, but the reality is (1) prudent lending standards, (2) the plethora of foreclosures and short sales, and (3) high unemployment due to the weak economy has greatly diminished the buyer pool. Couple this diminished buyer pool with abundant supplies of distressed properties, and you have a recipe for lower prices and anemic sales volumes.


.jpg)


 Astute Observation by Pascal