
I can't wait for the weekend to begin
I'm workin' all week long
I dream the days away
I wanna' sing my song
So let the music play
Michael Gray – The Weekend
Good news for your real estate consumption: prices are more affordable in 85% of US housing markets than they were just one year ago. A whopping 40% of all housing markets hit new lows since the bubble peak. Soon houses will be affordable everywhere.
Case-Shiller: U.S. Home Prices Keep Weakening as Eight Cities Reach New Lows in November
by CalculatedRisk on 1/25/2011 09:00:00 AM
S&P/Case-Shiller released the monthly Home Price Indices for November (actually a 3 month average of September, October and November).
This includes prices for 20 individual cities and and two composite indices (for 10 cities and 20 cities).
Note: Case-Shiller reports NSA, I use the SA data.
From S&P: U.S. Home Prices Keep Weakening as Eight Cities Reach New Lows
Data through November 2010, released today by Standard & Poor’s for its S&P/Case-Shiller1 Home Price Indices, the leading measure of U.S. home prices, show a deceleration in the annual growth rates in 17 of the 20 MSAs and the 10- and 20-City Composites compared to what was reported for October 2010. The 10-City Composite was down 0.4% and the 20-City Composite fell 1.6% from their November 2009 levels. Home prices fell in 19 of 20 MSAs and both Composites in November from their October levels. In November, only four MSAs – Los Angeles, San Diego, San Francisco and Washington DC – showed year-over-year gains. The Composite indices remain above their spring 2009 lows; however, eight markets – Atlanta, Charlotte, Detroit, Las Vegas, Miami, Portland (OR), Seattle and Tampa – hit their lowest levels since home prices peaked in 2006 and 2007, meaning that average home prices in those markets have fallen even further than the lows set in the spring of 2009.
Click on graph for larger image in new window.
The first graph shows the nominal seasonally adjusted Composite 10 and Composite 20 indices (the Composite 20 was started in January 2000).
The Composite 10 index is off 31.0% from the peak, and down 0.4% in November(SA).
The Composite 20 index is off 30.9% from the peak, and down 0.5% in November (SA).
The second graph shows the Year over year change in both indices.
The Composite 10 SA is down 0.4% compared to November 2009. This is the first year-over-year decline since 2009.
The Composite 20 SA is down 1.6% compared to November 2009.
The third graph shows the price declines from the peak for each city included in S&P/Case-Shiller indices.
Prices increased (SA) in only 3 of the 20 Case-Shiller cities in November seasonally adjusted.
Prices in Las Vegas are off 57.8% from the peak, and prices in Dallas only off 8.9% from the peak.
Prices are now falling – and falling just about everywhere. As S&P noted “eight markets – Atlanta, Charlotte, Detroit, Las Vegas, Miami, Portland (OR), Seattle and Tampa – hit their lowest levels since home prices peaked in 2006 and 2007”. Both composite indices are still slightly above the post-bubble low.
Have you noticed that mainstream media headlines always portray house price drops as bad and price increases as good? The facts are that house prices hit new lows in 40% of the markets surveyed (8 of 20).
The false bottom engineered by the federal reserve has been taken out in 40% of the nations real estate markets.
How will the other 60% fair?


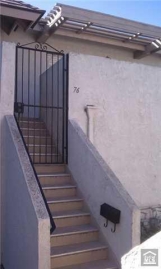
Irvine Home Address … 76 KAZAN St #36 Irvine, CA 92604 ![]()
Resale Home Price … $239,900
Home Purchase Price … $105,000
Home Purchase Date …. 7/24/98
Net Gain (Loss) ………. $120,506
Percent Change ………. 114.8%
Annual Appreciation … 6.5%
Cost of Ownership
————————————————-
$239,900 ………. Asking Price
$8,397 ………. 3.5% Down FHA Financing
4.84% …………… Mortgage Interest Rate
$231,504 ………. 30-Year Mortgage
$48,773 ………. Income Requirement
$1,220 ………. Monthly Mortgage Payment
$208 ………. Property Tax
$0 ………. Special Taxes and Levies (Mello Roos)
$40 ………. Homeowners Insurance
$185 ………. Homeowners Association Fees
============================================
$1,653 ………. Monthly Cash Outlays
-$114 ………. Tax Savings (% of Interest and Property Tax)
-$286 ………. Equity Hidden in Payment
$16 ………. Lost Income to Down Payment (net of taxes)
$30 ………. Maintenance and Replacement Reserves
============================================
$1,298 ………. Monthly Cost of Ownership
Cash Acquisition Demands
——————————————————————————
$2,399 ………. Furnishing and Move In @1%
$2,399 ………. Closing Costs @1%
$2,315 ………… Interest Points @1% of Loan
$8,397 ………. Down Payment
============================================
$15,510 ………. Total Cash Costs
$19,800 ………… Emergency Cash Reserves
============================================
$35,310 ………. Total Savings Needed
Property Details for 76 KAZAN St #36 Irvine, CA 92604 
——————————————————————————
Beds:: 2
Baths:: 1
Sq. Ft.:: 0900
Property Type:: Residential, Condominium
Style:: Two Level, Other
Year Built:: 1972
Community:: El Camino Real
County:: Orange
MLS#:: S644297
Source:: SoCalMLS
——————————————————————————
HUGE PRICE REDUCTION!! Great location close to 5 Fwy, Award winning Irvine Schools, and shopping. Quiet and private upstairs location, and close to HOA Amentities. Perfect for investors or the first time buyer.
This video was linked in the astute observations this week. It is a great weekend watch.
IHB Weekend Edition 
Why don't I write seven posts a week? Time away from my family is one obvious answer, but its more complicated than that. When I first started writing for the IHB, I didn't have access to the traffic counts, and I didn't watch to see if more or fewer people are reading. Traffic didn't matter. I wanted to write because I had something to say about house prices.
When I started watching traffic I noticed that the weekend had 30% less traffic no matter the content. As I grew to know the readership, I realized many people were reading the IHB in their offices, so they only checked Monday through Friday.
After a time of posting on weekends just like a weekday and trying new things, I resigned myself to the fact that fewer people were going to read on the weekend. I stopped doing normal property profiles and began leaving open threads similar to our old forums.
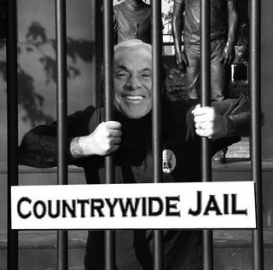
It's time for something new. I played with Photoshop and modified the American Gothic TV studio graphic to create a Weekend Edition.
I will create a weekday post to last two days. I may post about properties in Las Vegas or stories of our work out there. I do have some funny and interesting stories.
>Listed at: $199,000
Well that was fast (o:
Source
Feb 04, 2011 Price Changed $199,000 — Inactive SoCalMLS #1
Feb 04, 2011 Pending (Backup Offers Accepted) — — Inactive SoCalMLS #1
Feb 04, 2011 Price Changed $19,900 — Inactive SoCalMLS #1
Jan 19, 2011 Price Changed $239,900 — Inactive SoCalMLS #1
It was in Pending state when they dropped the price to $19k.
I’d take it at $19k. Hell, I’ll even up the ante to $20k 🙂
Affordability is a tricky term. What product is affordable and to whom? I don’t think there is anything about markets that dictate that prices remain ‘affordable’. Should the median home be affordable for the area’s median household? What if there are more households than homes, more homes than households?
With all the effort the economics profession puts into the efficiency of markets, more work needs to go into why some markets are inefficient. I work in semiconductors, a notoriously cyclical business. Might that have something to do with the cost and time to build a new factory? It takes a while to add housing stock also. It’s not the only factor that causes inefficiency (the time lag from first non-payment to the loss of a home is also a problem) but one that does not get enough attention.
The same idea of cheering high asset prices applies to stocks as well. If you think of a stock as owning the future profit stream of a corporation, then wouldn’t you want to pay less for a given level of profits, not more? High asset prices benefit asset owners at the expense of asset buyers.
High asset prices not only benefit asset owners at theexpense of asset buyers, they also benefit the middlemen involved in the transaction, (commis. fees, points, etc.) and those taxing the asset or money (property tax). So if you have no plans to sell, flip or become a middleman, the high housing prices help one feel that they are rich but are really poor due to the expense of upkeep. The HELOC, refinancers, flipper, middlemen came out rich or at least for a while on the backs of those that must clean up the mess or should I say pay for the mess. Great party with a big bill, just didn’t attend.
Low housing price, means low profits for the bank and moving that money to main street. Look at the early days, bankers were white collar middle class and merchants were upper class or lot richer than middle class. Now it hard in retail and was easy in banking.
>Low housing price, means low profits for the bank and moving that money to main street.
How can you explain that prices are high now but banks report losses?
When house prices were lower, banks charged higher interest rates; so they earned good profits.
I think you need to look at the percentage of total corporate profits ‘earned’ by the banking sector. Even down ~10% from peak, banks are earning more relative to the rest of the economy than they did for any year from 1948-1990.
Yes, the US banks are profitable because they rob savers.
0% interest rate when someone opens a saving account
20% interest rate when someone borrows using his credit card.
If the FED didn’t pump billions into the banks, they would surely have lower profits/higher losses. But since the FED wanted the banks to lend more than they normally would to stop the economy from a disastrous halt, the banks ended up with money that they didn’t want to spend by lending, so they just put them in a FED account for a small but certain interest.
that music video was pretty hot