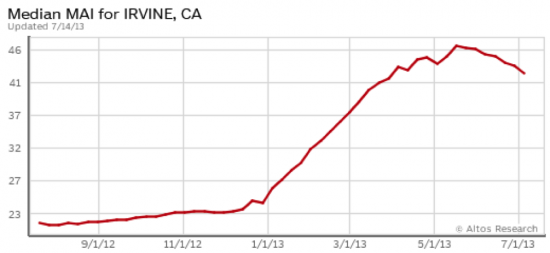
According to Altos Research, the Market Action Index (MAI) for Irvine’s single-family housing market is 42.57. As defined by Altos, this put the Irvine single-family housing market in the seller’s market category. (Above 30 is defined as a seller’s market; below is defined as a buyer’s market.) However, after a steady upward climb since the beginning of the year, Irvine’s MAI has started trending down. We will see if this holds true for next month.
Altos also states that the average single-family home in Irvine has been on the market for about 79 days as of July 5, 2013.

Following is Irvine’s June 2013 housing market data provided by Redfin.
| Type | List Price/# Homes Listed | Sold Price/# Homes Sold | List Per SF | Sold Per SF | % Chg Y-O-Y Sold Price/SF |
| Houses | |||||
| 13-Jun | $1,112K/186 | $855K/99 | $462 | $414 | 16% |
| 13-May | $1,030/167 | $890/113 | $457 | $411 | 21.60% |
| 13-Apr | n/a | n/a | n/a | n/a | n/a |
| 13-Mar | $1,020K/101 | $904K/62 | $443 | $381 | 13.40% |
| 13-Feb | na/109 | na/272 | $415 | $354 | n/a |
| 13-Jan | na/113 | na/274 | $409 | $357 | n/a |
| Condos | |||||
| 13-Jun | $585K/235 | $540K/130 | $418 | $391 | 24.90% |
| 13-May | $599K/177 | $539K/144 | $406 | $386 | 30.40% |
| 13-Apr | n/a | n/a | n/a | n/a | n/a |
| 13-Mar | $570K/111 | $476K/88 | $375 | $344 | 21.60% |
| 13-Feb | na/100 | na/301 | $369 | $325 | n/a |
| 13-Jan | na/106 | na/324 | $377 | $327 | n/a |
| All | |||||
| 13-Jun | $734K/456 | $638K/249 | $422 | $395 | 20.80% |
| 13-May | $750K/371 | $659K/274 | $416 | $393 | 26.80% |
| 13-Apr | n/a | n/a | n/a | n/a | n/a |
| 13-Mar | $703K/219 | $588K/151 | $392 | $359 | 18.90% |
| 13-Feb | na/209 | na/573 | $389 | $334 | n/a |
| 13-Jan | na/219 | na/598 | $389 | $338 | n/a |