Monthly Archives: October 2012

Irvine Housing by the Numbers – October Update

Here is an updated list of the housing numbers for each of Irvine’s neighborhood. Woodbury is still notable for having mostly year-over-year decreases this year. And after a mostly upward yearly trend, Turtle Rock has a 19% decrease in the year-over-year price per square foot.

Area

List Price/# Homes Listed

Sold Price/# Homes Sold

List Per SF

Sold Per SF

% Chg Y-O-Y Sold Price/SF

Airport/IBC

12-Sep

12-Aug

12-Jul

12-Jun

12-May

$787K/42

$520K/23

$594K/27

$511K/32

$459K/41

$370K/16

$431K/23

$468K/18

$328K/30

$514K/19

$399

$382

$406

$380

$356

$326

$328

$312

$312

$325

2.2%

13.5%

1%

-3.4%

5.90%

12-Apr

$442K/48

$340K/25

$350

$304

-5.90%

12-Mar

$415K/45

$412K/16

$348

$346

11.60%

12-Feb

$392K/48

$330K/15

$337

$288

-11.70%

12-Jan

$374K/52

$327K/18

$332

$317

-17%

Columbus Grove

n/a

El Camino

12-Sep

12-Aug

12-Jul

12-Jun

12-May

$540K/18

$600K/21

$624K/10

$579K/24

$555K/19

$399/19

$490/21

$455K/9

$504K/13

$435K/19

$380

$359

$408

$392

$365

$272

$334

$359

$327

$280

-21.4%

-7%

16.6%

16%

-17.2%

12-Apr

$572K/22

$458K/12

$329

$239

-22.10%

12-Mar

$546K/22

$468K/10

$329

$327

3.80%

12-Feb

$467K/26

$340K/5

$339

$281

-6.60%

12-Jan

$462K/28

$389K/6

$322

$267

-28.40%

Northpark

12-Sep

12-Aug

12-Jul

12-Jun

12-May

$870K/37

$809K/48

$844K/48

$774K/50

$700K/59

$460K/25

$488K/40

$540K/31

$460K/35

$438K/35

$333

$333

$348

$351

$329

$298

$289

$289

$297

$278

2.1%

-2.7%

-10%

1.4%

-7.3%

12-Apr

$649K/51

$390K/29

$339

$283

-10.04

12-Mar

$674K/50

$465K/36

$341

$281

-8.80%

12-Feb

$459K/74

$415K/13

$301

$280

-9.40%

12-Jan

$465K/91

$412K/19

$290

$277

-20.90%

Northwood

12-Sep

12-Aug

12-Jul

12-Jun

12-May

$777K/44

$735K/51

$727K/52

$692K/62

$697K/52

$518K/26

$612K/38

$650K/22

$525K/27

$584K/32

$341

$322

$323

$316

$314

$314

$317

$340

$295

$267

4.7%

7.1%

9%

-8.1%

-13%

12-Apr

$599K/59

$579K/30

$312

$310

5.10%

12-Mar

$519K/61

$518K/20

$316

$301

-1.60%

12-Feb

$504K/66

$292K/13

$300

$287

-7.10%

12-Jan

$489K/78

$518K/17

$286

$292

-7.60%

Oak Creek

12-Sep

12-Aug

12-Jul

12-Jun

12-May

$542K/16

$644K/16

$576K/12

$720K/19

$579K/17

$476K/8

$433K/16

$338K/12

$216K/10

$240K/8

$351

$328

$330

$330

$333

$310

$327

$288

$216

$281

-0.6%

-3.5%

-10.6%

-21.1%

-1.7%

12-Apr

$530K/19

$628K/14

$303

$315

5.90%

12-Mar

$425K/27

$284K/14

$309

$292

-1.40%

12-Feb

$487K/26

$267K/13

$317

$267

-15.80%

12-Jan

$350K/33

$249K/9

$308

$261

-20.40%

Orange Tree

12-Sep

12-Aug

12-Jul

12-Jun

12-May

$280K/6

$320K/3

$257K/2

$250K/3

$280K/3

0

$184K/2

$279K/4

$181K/6

$145K/2

$356

$289

$311

$307

$307

n/a

$214

$265

$251

$261

n/a

-41.5%

-23%

-10%

6.1%

12-Apr

$278K/6

$165K/1

$256

$203

-31.90%

12-Mar

$245K/9

$189K/6

$253

$279

4.10%

12-Feb

$242K/6

$200K/6

$249

$230

-33.50%

12-Jan

$216K/12

$205K/5

$252

$249

-13.50%

Portola Springs

12-Sep

12-Aug

12-Jul

12-Jun

12-May

$639K/22

$640K/26

$639K/33

$622K/31

$660K/23

$621K/13

$571K/11

$631K/12

$724K/8

$582K/13

$319

$324

$325

$321

$335

$322

$283

$317

$308

$284

1.3%s

-5.4%

1%

-4%

-4.10%

12-Apr

$693K/30

$596K/11

$330

$299

-11%

12-Mar

$639K/25

$950K/5

$325

$320

11.90%

12-Feb

$641K/31

$510K/1

$317

$249

-12%

12-Jan

$623K/43

$570K/7

$321

$293

1.40%

Quail Hill

12-Sep

12-Aug

12-Jul

12-Jun

12-May

$625K/15

$630K/15

$625K/13

$647K/14

$714K/18

$450K/7

$600K/12

$885K/8

$586K/12

$465K/13

$384

$392

$361

$373

$376

$325

$392

$389

$375

$347

-3.8%

11.4%

21.6%

8.1%

-13.0%

12-Apr

$749K/17

$863K/6

$373

$374

7.50%

12-Mar

$500K/21

$505K/9

$360

$317

-3.10%

12-Feb

$515K/21

$470k/6

$364

$307

-10.80%

12-Jan

$560K/20

$512K/8

$324

$326

-13.30%

Rancho San Joaquin

12-Sep

12-Aug

12-Jul

12-Jun

12-May

$485K/3

$449K/4

$509K/3

n/a

$475K/5

$495K/2

$460K/3

$433K/2

$410K/2

$346

$339

$320

$313

$336

$307

$269

$306

13.9%

-9.7%

-6.3%

-2%

12-Apr

n/a

12-Mar

$465K/5

$500K/2

$246

$296

n/a

12-Feb

$492K/6

$360K/1

$297

$336

n/a

12-Jan

n/a

Shady Canyon

12-Sep

12-Aug

12-Jul

12-Jun

12-May

$6,142K/24

$6,922K/26

$6,000K/27

$5,998K/26

$6,000K/25

$4,390K/2

$3,124K/4

$4,555K/3

$3,700K/3

$4,019K/6

$752

$770

$760

$761

$705

$748

$561

$586

$552

$673

19.7%

-3.9%

15.4%

-10%

30.70%

12-Apr

$5,995K/23

$4,875K/4

$720

$512

-6.10%

12-Mar

$5,980K/21

$4,436K/4

$720

$657

28.80%

12-Feb

$5,995K/23

$3,200K/3

$725

$603

7.50%

12-Jan

$5,980K/23

$2,670K/5

$720

$534

24.20%

Turtle Ridge

12-Sep

12-Aug

12-Jul

12-Jun

12-May

$1,750K/19

$1,825K/21

$1,848K/25

$1,875K/27

$1,749K/31

$1,875K/8

$1,950K/9

$1,440K/12

$1,360K/11

$1,044K/8

$589

$567

$571

$570

$545

$525

$504

$510

$467

$459

9.1%

22%

14.9%

4.7%

0.10%

12-Apr

$1,724K/28

na/8

$533

$421

5.20%

12-Mar

$1,899K/28

$1,500K/7

$550

$485

-8.30%

12-Feb

$1,899K/27

$955K/4

$527

$441

18.90%

12-Jan

$1,672K/32

$532K/4

$493

$355

-25.30%

Turtle Rock

12- Sep

12-Aug

12-Jul

12-Jun

12-May

$812K/24

$825K/27

$837K/32

$865K/37

$939K/37

$790K/10

$932K/14

$975K/10

$915K/20

$730K/9

$396

$399

$421

$457

$454

$406

$465

$451

$446

$410

-19%

14.8%

19.3%

3.2%

3.3%

12-Apr

$986K/43

$1,050K/5

$457

$461

10.30%

12-Mar

$967K/40

$690K/11

$448

$381

17.60%

12-Feb

$1,024K/38

$1,422K/4

$457

$559

14.30%

12-Jan

$974K/40

$545K/8

$458

$295

-14.20%

University Park

12- Sep

12-Aug

12-Jul

12-Jun

12-May

$660K/11

$631K/8

$699K/7

$599K/12

$602K/12

$594K/10

$520K/12

$560K/5

$540K/10

$539K/8

$324

$359

$331

$345

$346

$323

$333

$312

$333

$291

-5%

6.1%

-9%

6.4%

6.20%

12-Apr

$609K/11

$538K/7

$352

$272

-15%

12-Mar

$552K/14

$431K/6

$288

$305

-5.60%

12-Feb

$578K/14

$555K/4

$297

$286

9.60%

12-Jan

$595K/14

$420K/7

$289

$281

-10.80%

University Town Center

12- Sep

12-Aug

12-Jul

12-Jun

12-May

$489K/2

$355K/3

$435K/10

$440K/7

$440K/5

$365K/5

$411K/4

$430K/6

$295K/2

$450K/5

$393

$399

$368

$384

$371

$344

$333

$316

$322

$311

13.9%

9.9%

-10%

17.1%

6.90%

12-Apr

$340K/3

$375K/5

$338

$326

6.90%

12-Mar

$455K/7

$478K/4

$298

$321

1.90%

12-Feb

$347K/6

$384K/1

$342

$265

-19.50%

12-Jan

$467K/10

$480K/1

$330

$315

n/a

Walnut

12- Sep

12-Aug

12-Jul

12-Jun

12-May

$582K/8

$630K/8

$626K/14

$659K/5

$628K/5

$597K/6

$575K/4

$528K/1

$540K/5

$595K/5

$340

$330

$330

$307

$309

$298

$303

$321

$280

$314

2.4%

-1.3%

-4.2%

-9.4%

14.6%

12-Apr

$532K/3

$580K/5

$313

$306

-1%

12-Mar

$619K/5

$635K/3

$327

$300

3.40%

12-Feb

$600K/5

$509K/3

$316

$310

-9.40%

12-Jan

$600K/11

$596K/4

$298

$259

-12.80%

West Irvine

n/a

Westpark

12- Sep

12-Aug

12-Jul

12-Jun

12-May

$690K/13

$558K/12

$615K/11

$823K/13

$628K/5

$662K/8

$740K/5

$480K/3

$670K/4

$595K/5

$352

$357

$329

$360

$309

$334

$345

$291

$318

$314

11%

6.2%

-20.3%

-10.4%

14.60%

12-Apr

$624K/14

$651K/8

$360

$304

-10.30%

12-Mar

$565K/17

$615K/10

$319

$331

-2.50%

12-Feb

$649K/21

$506K/6

$319

$361

21.50%

12-Jan

$552K/20

$695K/2

$331

$356

-11.20%

Woodbridge

12- Sep

12-Aug

12-Jul

12-Jun

12-May

$660K/37

$678K/34

$625K/37

$570K/39

$586K/50

$518K/26

$475K/30

$500K/33

$508K/36

$430K/25

$348

$352

$350

$357

$350

$309

$310

$318

$340

$307

3.7%

-3.1%

3.2%

8.6%

-6.40%

12-Apr

$554K/68

$422K/29

$347

$289

-8%

12-Mar

$494K/68

$345K/31

$339

$283

-9.30%

12-Feb

$459K/83

$399K/23

$328

$312

-4.90%

12-Jan

$435K/93

$402K/15

$317

$273

-6.20%

Woodbury

12- Sep

12-Aug

12-Jul

12-Jun

12-May

$915K/18

$732K/27

$845K/25

$823K/30

$872K/24

$535K/11

$480K/9

$452K/9

$470K/15

$650K/11

$353

$326

$353

$359

$363

$328

$305

$295

$316

$310

-1.2%

0%

3.5%

-5.4%

-3.40%

12-Apr

$784K/30

$475K/14

$357

$291

-9.30%

12-Mar

$680K/35

$678K/21

$334

$289

0%

12-Feb

$650K/33

$419K/8

$330

$298

-4.70%

12-Jan

$611K/44

$460K/8

$314

$292

-16.80%

Source: Redfin.com (http://www.redfin.com/home)
Open House Review: 164 Weathervane

Quail Hill CloseUp

164 Weathervane $1,399,000

Awhile ago I reviewed two Quail Hill condo open houses. Both condos were sleek and compact, sitting in the midst of a park-like world, just minutes away from the 405 Freeway and Laguna Canyon.

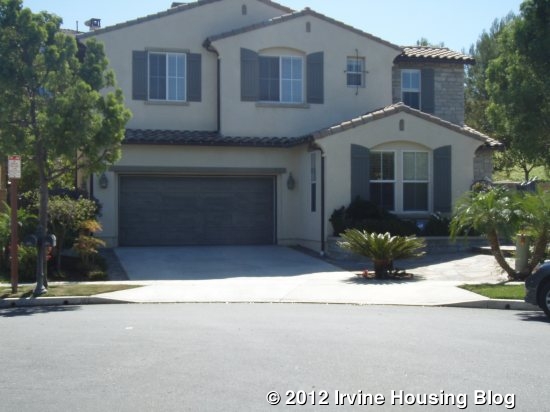
Now I was headed to Quail Hill to see a single family home, 164 Weathervane, a two level Tuscan style home that just came on the market.

Looking at the numbers, this home was built in 2004. It has 3,000 square feet in a two level floor plan with 4 bedrooms, and 4.5 baths. The lot size is 5,294. $/sq. ft is $456. HOA dues are $252 month. It has Mello Roos tax.

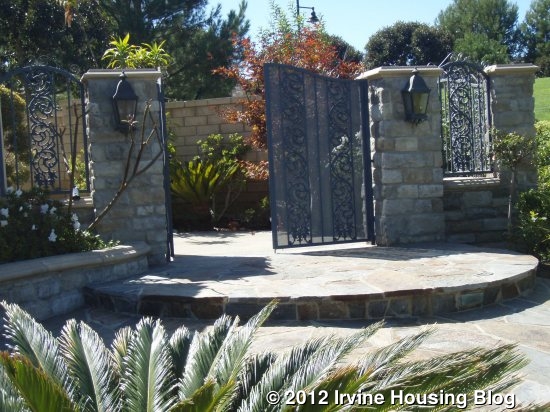
Close-up: Turning onto the cul de sac and heading up the hill, this home sits at the top on the left, next to the rolling greenbelt park. From the dramatic sweep of the greenbelt to the ornate gate and entrance, a lot of positives click as you enter this home.

Inside, elegance, ease and thoughtful function are all dialed into an open floor plan. The entrance opens to a luxe living room on the left with a formal dining room on the right. Hardwood, travertine tile and carpet all work well here, along with many windows and recessed lighting.

Throughout the home there are all sorts of space options that will allow the buyers to tailor the house to their lifestyle and priorities.

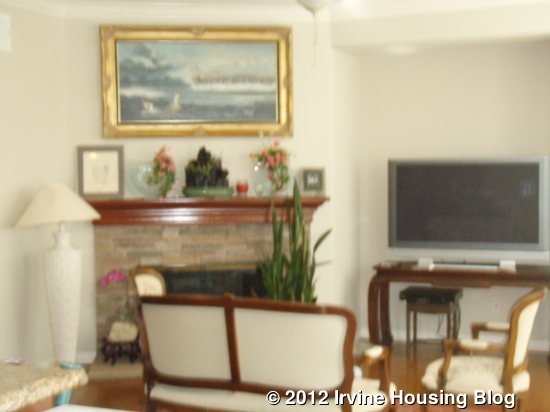
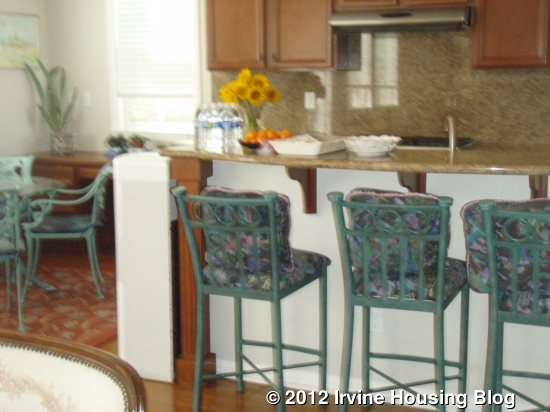
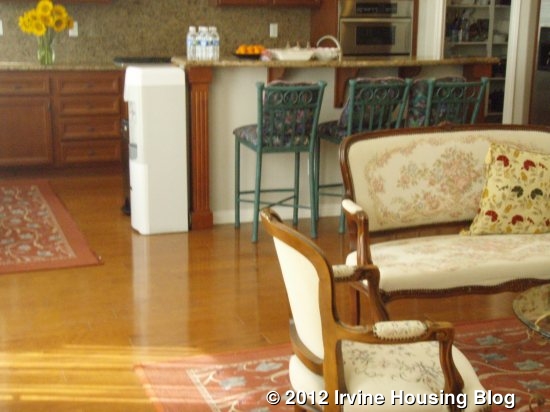
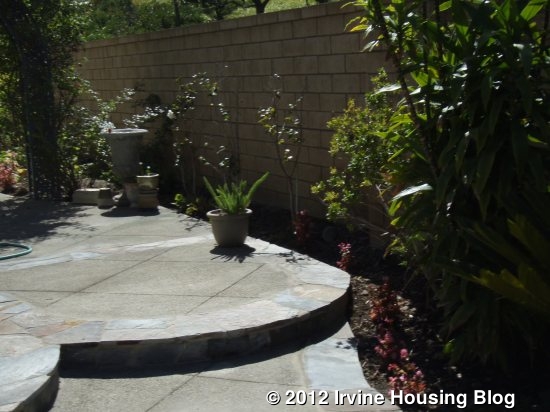
Moving through the hall a “great room” with a view of the greenbelt/park provides the family room with fireplace, kitchen with breakfast bar, built in desk unit, and casual dining area overlooking the back yard and covered patio.

This area can easily do double duty, handling a major part of the family’s daily activities, and then rolling out a super party with the overflow heading for an impressive backyard with covered patio, brick wall and wrought iron fencing.

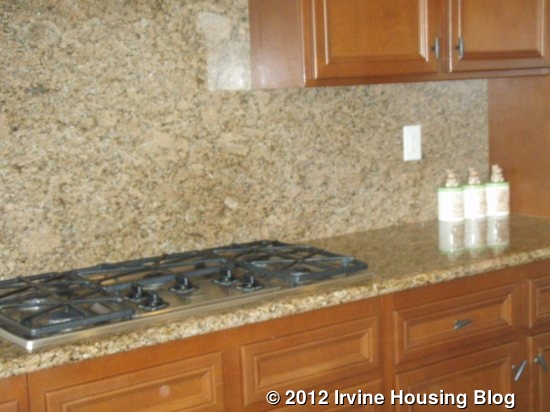
The kitchen has granite counters and stainless appliances with an island counter. There is also a bedroom and bath on the main floor.

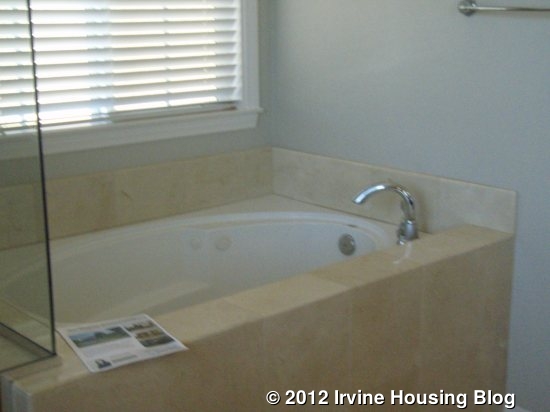
Upstairs there is an open staircase with loft, master bedroom with retreat, which could become two rooms, and bath that includes a tub with jets, plus the other bedrooms.

Specifics for this Single Family Home:

Bedrooms, 4

Baths, 4 full, 1 partial bath

3,000 sq. ft.

Lot size,

Built in 2004

Detached/no common walls

Double garage

Two parking spaces

Stone and stucco exterior

Roof: clay tile

Forced air heating

Central air

Association pool, spa

Irvine School System

Considerations and Comparisons: This home is a standard sale that’s new to the market. Its prime location, age, award winning schools and superb recreation facilities will all be factored in with the price and the number of properties currently available.

Who will move into this Quail Hill home? A family who values open areas and wants top schools will be attracted to this spacious home. Couples with extended families, or frequent guests, will be drawn to all of the home’s assets, and easy access to Orange County’s urban attractions, beaches and services.

Recent sales: 7 Stillwater, $1,220,000 in June; 1 Bluff Vw, $149,000 in April; Recent listings: 144 Treehouse, $1,049,000; 121 Lattice, $1,188,000.

Discuss on Talk Irvine: http://www.talkirvine.com/index.php/topic,3204.0.html

Dollhouses of Irvine

Over the weekend, I assembled a dollhouse for my daughter. It's a tri-level beauty. Kitchen, dining room and patio on the first floor. Living room/ Family room on the second floor. Bedroom with a small Juliette's balcony on the third floor. As I tightened the final screw on the roof, and stepped back to marvel at the end product, the first thing that came to my mind were the multilevel Irvine condominiums. When we were house hunting, our Realtor showed us a few of those cardio-masterpieces. How are they doing now? Let's take a look.

Entry and garage, an optional second bedroom on the first floor, living/dining/laundry /kitchen/deck and little technology space tucked in a corner make up the second floor, and third floor has the master suite. Just like a dollhouse, the 'Jasmine' homes come with all bells and whistles.

31 Flower Bud, Irvine CA 92603

Listing Price: $440,000 (Short Sale)

Beds/ baths: 2 bedrooms/ 2.5 bathrooms

Area: 1426 SF

Village: Quail Hill

Builder Tract Name: Jasmine

Builder Tract Code: JASM

Last Sale: $590,000 in June 2007 (that last sip of cool-aid!)

HOA Dues: $108 according to the listing

(But I think this property has two HOAs, $110+$186)

Mortgage/Month at 3.5: $1630

Property taxes: $4620 Annually

Mello Roos: $1820 Annually

Fixed Monthly Expenses: $2,462 Monthly

Sales history for similar houses in 2012:

45 Flowerbud $302/SF

54 Vermillion $325/SF

28 Perennial $318/SF

312 Dewdrop $303/SF

66 Vermillion $347/SF

205 Dewdrop $310/SF

50 Vermillion $340/SF

254 Dewdrop $318/SF

Also, here is a sales history of the year where cool-aid and its potential side effects were identified, but everybody thought their little nest was immune:

231 Dewdrop $448/SF

55 Flowerbud $485/SF

78 Dovetail $480/SF

50 Perennial $490/SF

92 Dovetail $464/SF

224 Dewdrop $475/SF

34 Dovetail $541/SF

36 Vermillion $483/SF

240 Dewdrop $450/SF

47 Flowerbud $414/SF

38 Vermillion $438/SF

The “Jasmines' have lost more than a $100/SF in the past six years. The property I have showcased in the blog today has lost 25% of its value. No wonder people are walking out on their properties. With lending rules a little relaxed and the record low mortgage rates, these properties will also get their due, and recover some of their losses in the next few years. But deflation and slow recovery of the job market will hold the prices back.

How did the housing bubble and the subsequent burst affect you?

Do you own a property that has lost more than 25% of its value?

Did you sell at the peak and lock in the profits?

Discuss below or at Talk Irvine.

Closed Sales from 10/4/2012 to 10/10/2012

Date Sold Address Zip Tract Sold Price Beds Sq Ft
Airport Area
10/4/12 5103 Scholarship 92612 The Plaza (5000 and 8000) $1,400,000 2 2385
10/9/12 3313 Watermarke Pl 92612 Watermarke $210,000 1 635
10/9/12 3222 Watermarke Pl 92612 Watermarke $425,000 2 1250
10/9/12 2253 Martin Ct 208 92612 Metropolitan $270,000 1 800
Columbus Grove
10/5/12 323 Silk Tree 92606 Savannah $465,000 3 1500
El Camino Real
10/5/12 6 Buckeye 92604 Irvine Groves $465,000 3 1707
10/5/12 9 Springfield 92604 Heritage Park IP $342,000 3 1200
10/10/12 5162 Skinner St 92604 Ranch $705,000 4 2317
10/10/12 14 Heritage 92604 Heritage Park $300,000 2 1109
Northpark
10/10/12 10 Upland 92602 Miramar $903,000 4 2810
Northwood
10/9/12 89 WONDERLAND 92620 Bella Rosa $670,000 4 2630
10/9/12 3 Lynnfield 92620 Lexington II $927,500 5 2800
10/10/12 55 Darlington 92620 Greystone Villas $545,000 3 1650
10/10/12 121 Islington 92620 Greystone Villas $530,000 3 1650
Oak Creek
10/9/12 2 Dahlia 92618 Cypress $670,000 3 1750
10/10/12 30 Carnation 92618 Montilla $539,000 3 1525
Orangetree
10/10/12 20 Tangelo 286 92618 other $257,200 2 954
Turtle Ridge
10/5/12 82 Gingerwood 92603 Whispering Glen $495,000 2 1500
10/5/12 21 Highpoint 92603 Amberhill $2,600,000 4 4200
10/9/12 125 Jadestone 92603 Ashton Green $390,000 2 1180
Walnut
10/9/12 10 Rhode Island 92606 Cambridge $870,000 5 2872
West Irvine
10/5/12 111 Waterman 147 92602 Wisteria $595,000 4 1728
10/5/12 6 Sorenson 92602 Barrington $725,000 4 2200
Westpark
10/4/12 15 Giovanni Aisle 357 92614 Tiempo $262,000 1 830
10/9/12 62 Costero Aisle 308 92614 Tiempo $248,000 1 692
10/10/12 34 Santa Comba 92606 Montage $838,800 4 2300
10/10/12 1201 Reggio Aisle 92606 Aventura $390,000 2 1050
Woodbridge
10/4/12 420 E Yale Loop 31 92614 Garden Estates $430,000 3 1749
10/4/12 3 Hazelnut 92614 Briarglen $625,000 3 1587
10/9/12 15 Daybreak 92614 Landing I $880,000 4 2366
10/9/12 59 Coral Lake 92614 Lakeside $760,000 3 2043

Discuss on Talk Irvine: http://www.talkirvine.com/index.php/topic,3193.0.html

A Closer Look at Irvine’s Woodbridge Housing Market

Last week I wrote about some new homes (The Branches) that will be built in Irvine’s well established Woodbridge neighborhood. To get a better idea how these “coming soon” Woodbridge homes compare with existing Woodbridge homes, today we will take a look at Irvine’s Woodbridge neighborhood.

First, the numbers: Woodbridge—August 2012:

Area

List Price/

# Homes Listed

Sold Price/ #Homes Sold

Median List/SF

Median Sold/SF

% Chg Y-O-Y Sold Price/SF

Houses

$759K/11

$725K/6

$371

$368

-0.5%

Condos

$589K/23

$303K/24

$333

$303

4.8%

All Woodbridge

$678K/34

$475K/30

$352

$310

-3.1%

All Irvine

$736K/390

$536K/267

$362

$328

3.5%

The following graphs show the change in the number of Woodbridge homes on the market (inventory), the price per square foot of Woodbridge houses, and the price per square foot of Woodbridge condos, respectively.

To give more meaning to these numbers and graphs, I am listing some homes that are near the bottom, top, and middle of the price range for homes in the Woodbridge real estate market.

193 Briarwood (http://www.redfin.com/CA/Irvine/193-Briarwood-92604/unit-37/home/5506026)

Note: This home is one of the least expensive homes in Woodbridge that is not “sale pending” or a manufactured home.

• Condo built in 1978 (one common wall and one carport space)

• Beds/Baths: 3/1.25 (1135 sf)

• HOA Dues: $372/month

• Mello Roos Tax: No

• Price: $355,000/$313 per square foot

35 Waterway (http://www.redfin.com/CA/Irvine/35-Waterway-92614/unit-1/home/5642920)

Note: Although this is not the most expensive home in Woodbridge, it is one of the more expensive Woodbridge homes.

• Condo built in 1985 (one common wall)

• Beds/Baths: 3/2.5 (2700 sf)

• HOA Dues: $210/month and $82/month

• Mello Roos Tax: No

• Price: $975,900/$361 per square foot

89 West Yale Loop (http://www.redfin.com/CA/Irvine/89-W-Yale-Loop-92604/unit-6/home/5463973)

• Condo built in 1977 (one common wall)

• Beds/Baths: 4/2.5 (2156 sf)

• HOA Dues: $442/month.

• Mello Roos Tax: No

• Price: $649,900/$301 per square foot

Source: Redfin