The Irvine housing market has five months of supply of homes available for sale which represents almost a 20% increase over last month's measure.


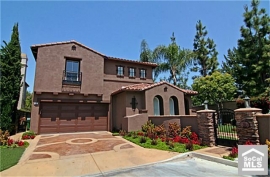
Irvine Home Address … 21 UPLAND Irvine, CA 92602
Resale Home Price …… $899,999

Well I'm takin' my time, I'm just movin' along
You'll forget about me after I've been gone
And I take what I find, I don't want no more
It's just outside of your front door.
Boston — Foreplay/Long Time
Houses are taking a long time to sell in Irvine today. It's rare to see this kind of weakness in Irvine. Usually, the constricted supply keeps prices elevated and makes the pace of sales relatively brisk. That is not today's market.
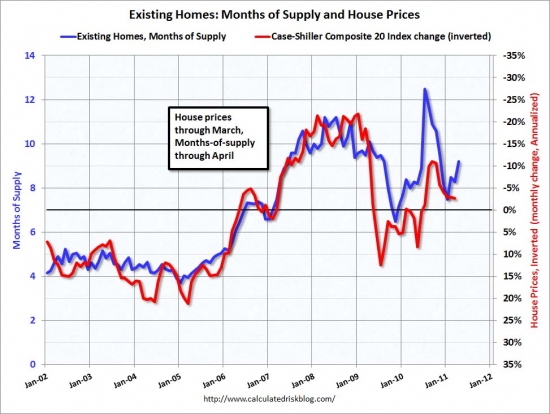
Months of supply is a good indicator of macro trends impacting the US housing market. The chart below from Calculated Risk shows the strong correlation between months of supply and the change in price.

Months of supply is my least favorite indicator of market action on a local level. It's too volatile, and it says little about the forces underlying the market. The smaller the area, the more volatile it becomes because there are so few data points. Of course, that doesn't mean realtors don't try to use it. Since it is volatile, it's relatively easy to make note of recent changes and blow them out of proportion to create false urgency.
Irvine homes take 9% more time to sell
By JONATHAN LANSNER — October 12, 2011
One analysis of real estate for sale in Irvine shows the market speedier in its last tabulation.
Every two weeks, Orange County broker Steve Thomas publishes a report on the supply of local homes for sale. Here's what the latest report — as of Sept. 29 — has to say about Irvine …
- 769 residences listed in brokers' MLS system with 196 new deals opening in the past 30 days.
- By Thomas's math, this community has a “market time” (months in would take to sell all inventory at current pace of new escrows) of 3.92 months vs. 4.00 months found two weeks earlier vs. 4.77 months seen a year earlier. Countywide, latest market time was 3.61 months vs. 4.28 months a year ago.
- So, homes in this community sell — in theory — in 9% more time than the countywide pace.
- Of the homes listed for sale in this community, 203 were either foreclosures being resold or short sales, where sellers owe more than the home's value. So distressed properties were 26.4% of supply of homes for sale vs. 34.7% countywide.
- Homes for sale in Irvine represent 7.4% of Orange County inventory — and 5.7% of all the distressed homes listed for sale in Orange County. New escrows here are 6.8% of all Orange County's new pending sales.
Compare these trends to countywide patterns:
I have a problem with Steve Thomas's math. Rather than use the accepted method of calculation — inventory divided by closed sales — Thomas uses opened escrows, a number always larger than closed sales because many properties fall out of escrow. By making the denominator of this fraction larger, he consistently understates the actual months of supply. Closed sales is an easy number to obtain from the MLS data, so there is no reason to use opened escrows over closed sales other than the desire to make the months of supply look smaller. A smaller month of supply number makes the market look better than it really is, and appears to be intended to create false urgency in buyers.
Below are the actual calculations of months of supply done properly for Irvine over the last two months by zip code. The volatility of the numbers is apparent. The increase in months of supply from 4.3 to 5.0 is nearly a 20% increase from August to September.

Zip codes that were disasters in August were healthy in September and visa versa. The usefulness of this information is suspect. How should someone use this data? Should buyers accelerate their plans or put them off? What about sellers? I doubt many people base their decisions on this data, nor should they.

From the post yesterday, 92603 (Turtle Rock, Turtle Ridge and Quail Hill) are the villages showing the most recent weakness, and the months of supply does reinforce that idea. Aggregate numbers are somewhat more accurate because they are less susceptible to small changes in inventory or sales. The aggregate numbers for Irvine also show the increased months of supply caused by hefty inventories and slow sales. However, months of supply is generally going to increase in September and October because sales drop off faster than inventory is removed from the market. It's November when sellers typically give up and hibernate for the winter. The sellers active from mid-November through February are the most motivated.
Horrible realtor ad of the day
Home ownership is under attack… or is it that loan owners are not being responsible with their payments? From the video below, you would assume responsible people are being forced out of their homes. The reality is irresponsible people are being forced out of the bank's home.

25%-30% off the high end
The owners of today's featured property paid $1,200,000 in the summer of 2005 using a $959,900 first mortgage and a $100,000 HELOC. The house appreciated for a year, and they increased their mortgage to a $1,000,000 first mortgage and a $96,500 HELOC. It appears they have been dutifully paying the mortgage ever since.
However, most people who attempt a short sale aren't paying their mortgage, so they could be delinquent and in shadow inventory (delinquent on the mortgage and no notices filed). In any case, their asking price is 25% less than they paid, and if it sells, they will lose their down payment, and the lender will be out a nice chunk as well. This is the kind of short sale that will take forever to get approved as the lenders will not want to absorb the loss and the borrower will not want to pay the difference.
——————————————————————————————————————————————-
This property is available for sale via the MLS.
Please contact Shevy Akason, #01836707
949.769.1599
sales@idealhomebrokers.com


Irvine House Address … 21 UPLAND Irvine, CA 92602
Resale House Price …… $899,999
Beds: 6
Baths: 4
Sq. Ft.: 3100
$290/SF
Property Type: Residential, Single Family
Style: Two Level, Mediterranean
View: Mountain, Yes
Year Built: 2001
Community: Northpark
County: Orange
MLS#: S659815
Source: SoCalMLS
On Redfin: 146 days
——————————————————————————
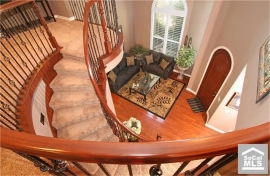
Spectacular luxury gem neslted in highly sought-after gated neighborhood on quiet cul de sac. Loaded with opulent finishes and offering ample natural light – this gem will be the pride of any homeowner. Great features include: beautiful hardwood and/or travertine flooring. Great yard ideal for entertaining. WOW!
——————————————————————————————————————————————-
Proprietary IHB commentary and analysis ![]()
Resale Home Price …… $899,999
House Purchase Price … $1,200,000
House Purchase Date …. 6/22/2005
Net Gain (Loss) ………. ($354,001)
Percent Change ………. -29.5%
Annual Appreciation … -4.4%
Cost of Home Ownership
————————————————-
$899,999 ………. Asking Price
$180,000 ………. 20% Down Conventional
4.20% …………… Mortgage Interest Rate
$719,999 ………. 30-Year Mortgage
$179,552 ………. Income Requirement
$3,521 ………. Monthly Mortgage Payment
$780 ………. Property Tax (@1.04%)
$0 ………. Special Taxes and Levies (Mello Roos)
$187 ………. Homeowners Insurance (@ 0.25%)
$0 ………. Private Mortgage Insurance
$150 ………. Homeowners Association Fees
============================================
$4,638 ………. Monthly Cash Outlays
-$825 ………. Tax Savings (% of Interest and Property Tax)
-$1001 ………. Equity Hidden in Payment (Amortization)
$270 ………. Lost Income to Down Payment (net of taxes)
$132 ………. Maintenance and Replacement Reserves
============================================
$3,215 ………. Monthly Cost of Ownership
Cash Acquisition Demands
——————————————————————————
$9,000 ………. Furnishing and Move In @1%
$9,000 ………. Closing Costs @1%
$7,200 ………… Interest Points @1% of Loan
$180,000 ………. Down Payment
============================================
$205,200 ………. Total Cash Costs
$49,200 ………… Emergency Cash Reserves
============================================
$254,400 ………. Total Savings Needed
——————————————————————————————————————————————————
I have no idea what the intended message is for that Realtard® ad. As is if “Suzanne researched this….” wasn’t bad enough.
I took it as propaganda attempting to show that their lobbying efforts are not greedy, self-interested attempts to line their pockets, but they are just trying to protect all homeowners.
Really PR to help deflect any fingering pointing that they were the ones who bear much of the responsibility for getting the world into this mess.
From the video:
“Realtors are here to represent you and protect home ownership” my ass.
6%’ers do the opposite: they don’t guarantee the condition, size or permitting of the house, or the contents of any legal agreement, yet have their hand out for a commission anyway.
Note to bank:
Take a nasty loss now, or take a far nastier loss later.